
Instrumental Study of the Health Status of Picea abies [L.] Karst and Pinus mugo (Turra) and Their Relation to Environmental Parameters in the Eastern Alps


Abstract
:1. Introduction
2. Materials and Methods
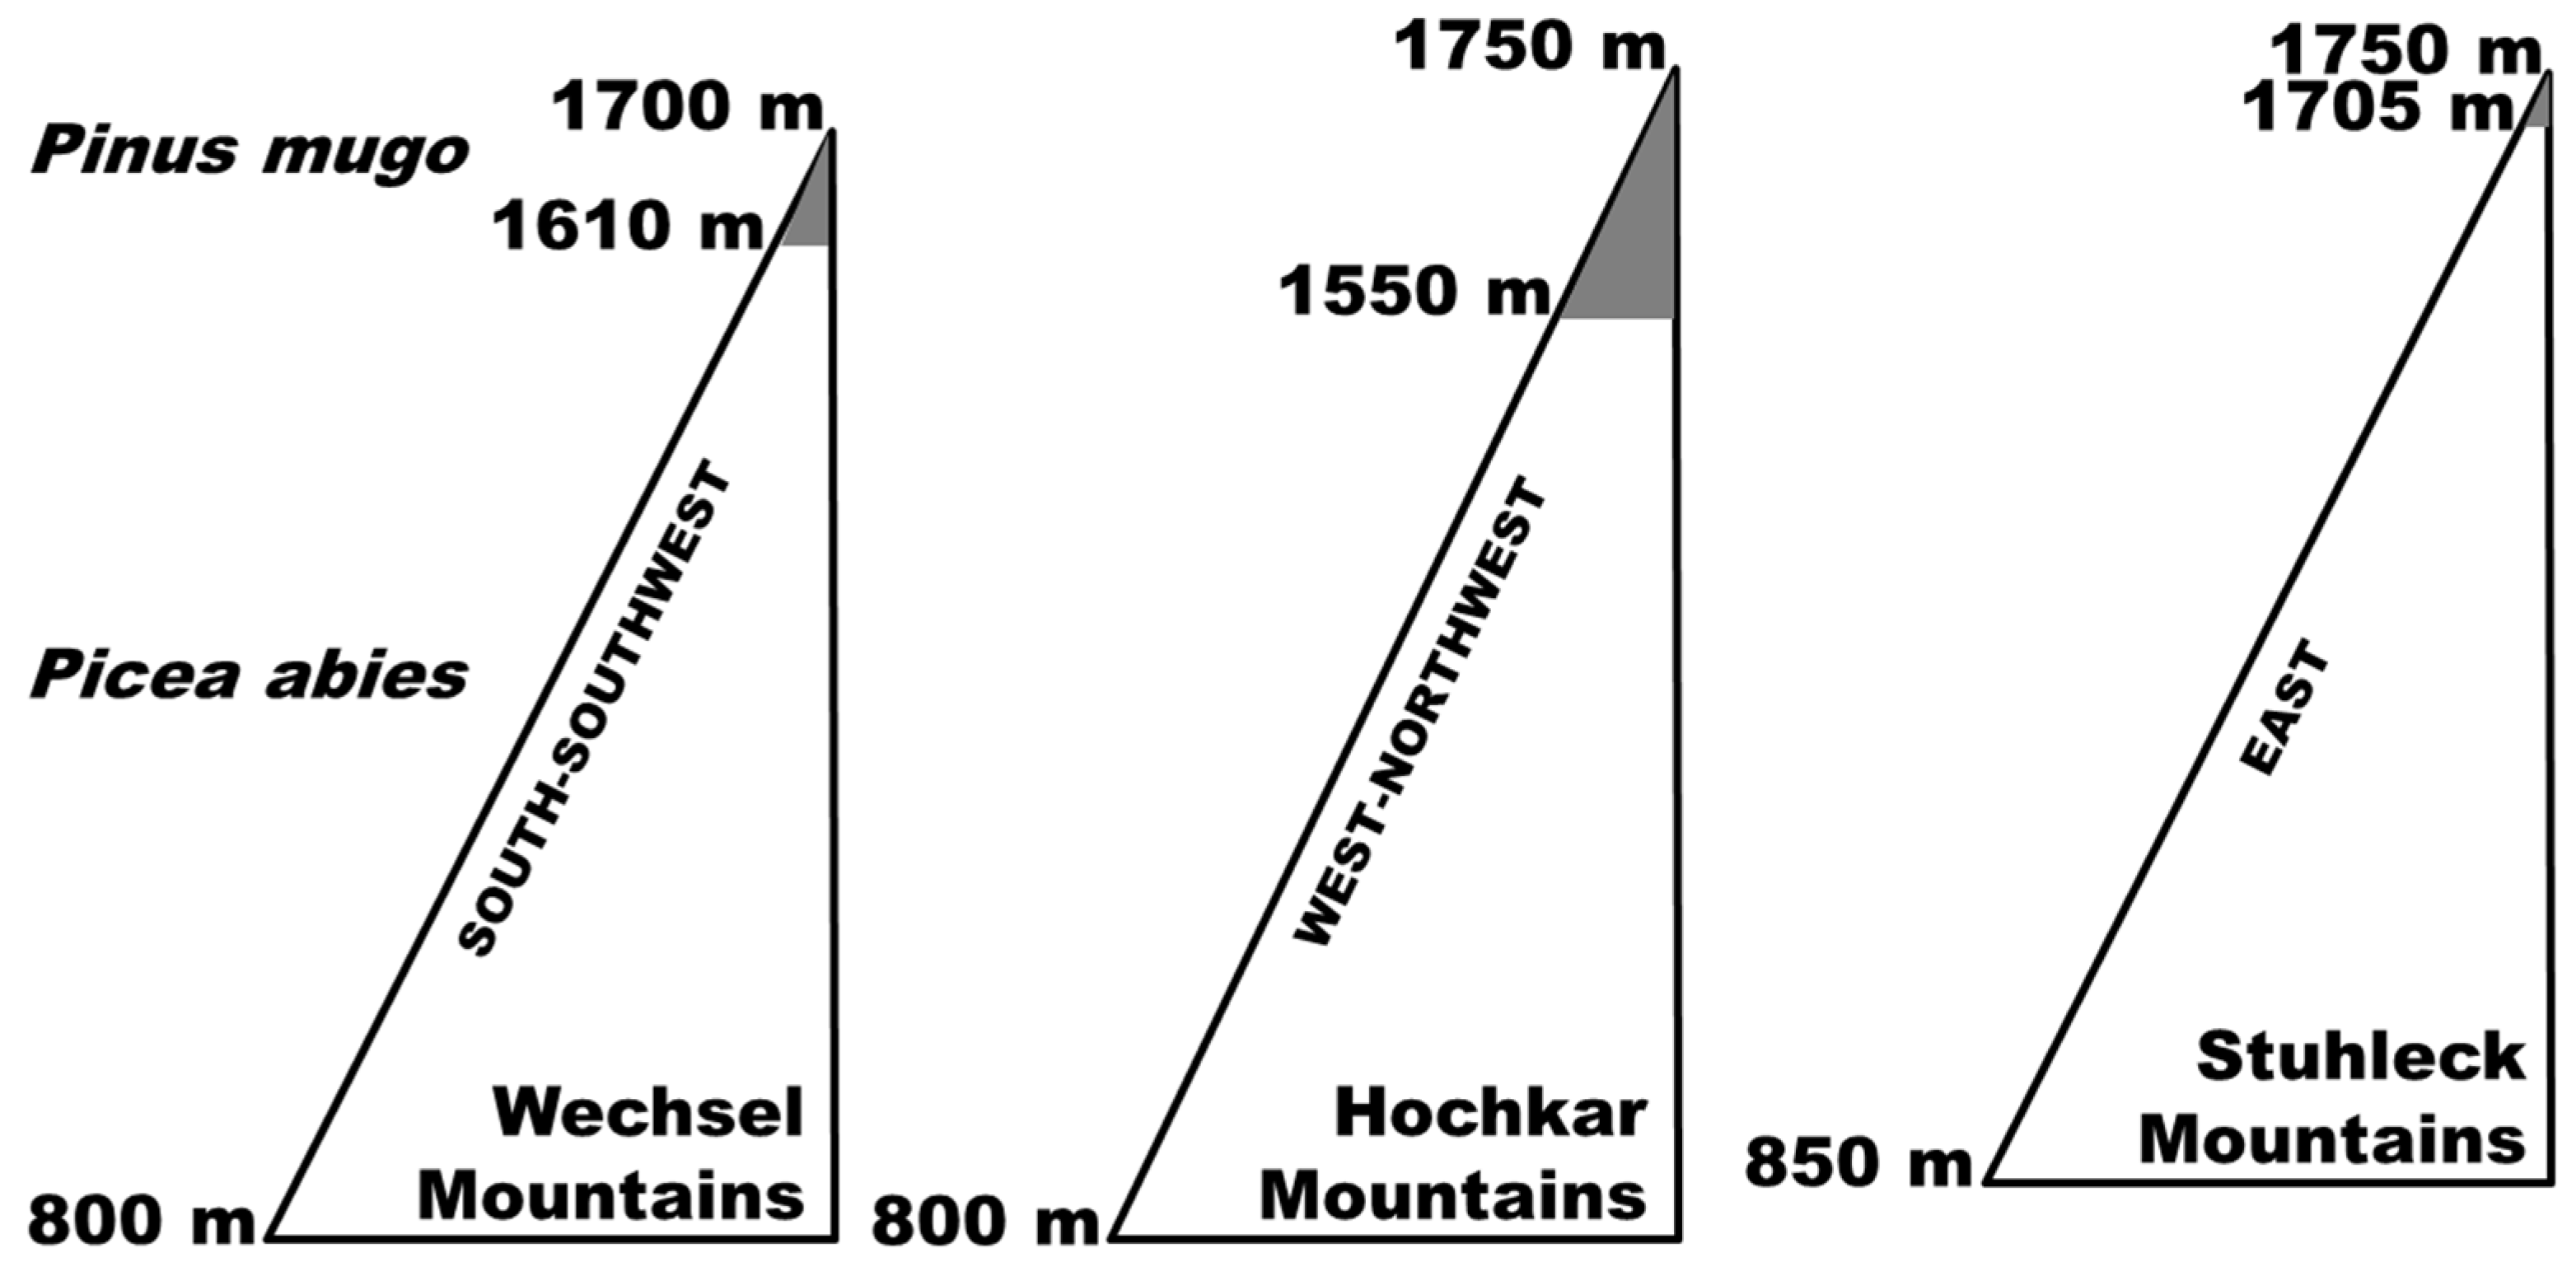
2.1. Study Sites
2.2. Methods
2.3. Measurements of Biotic and Abiotic Data (Environmental Parameters)
2.4. Statistical Analysis
3. Results
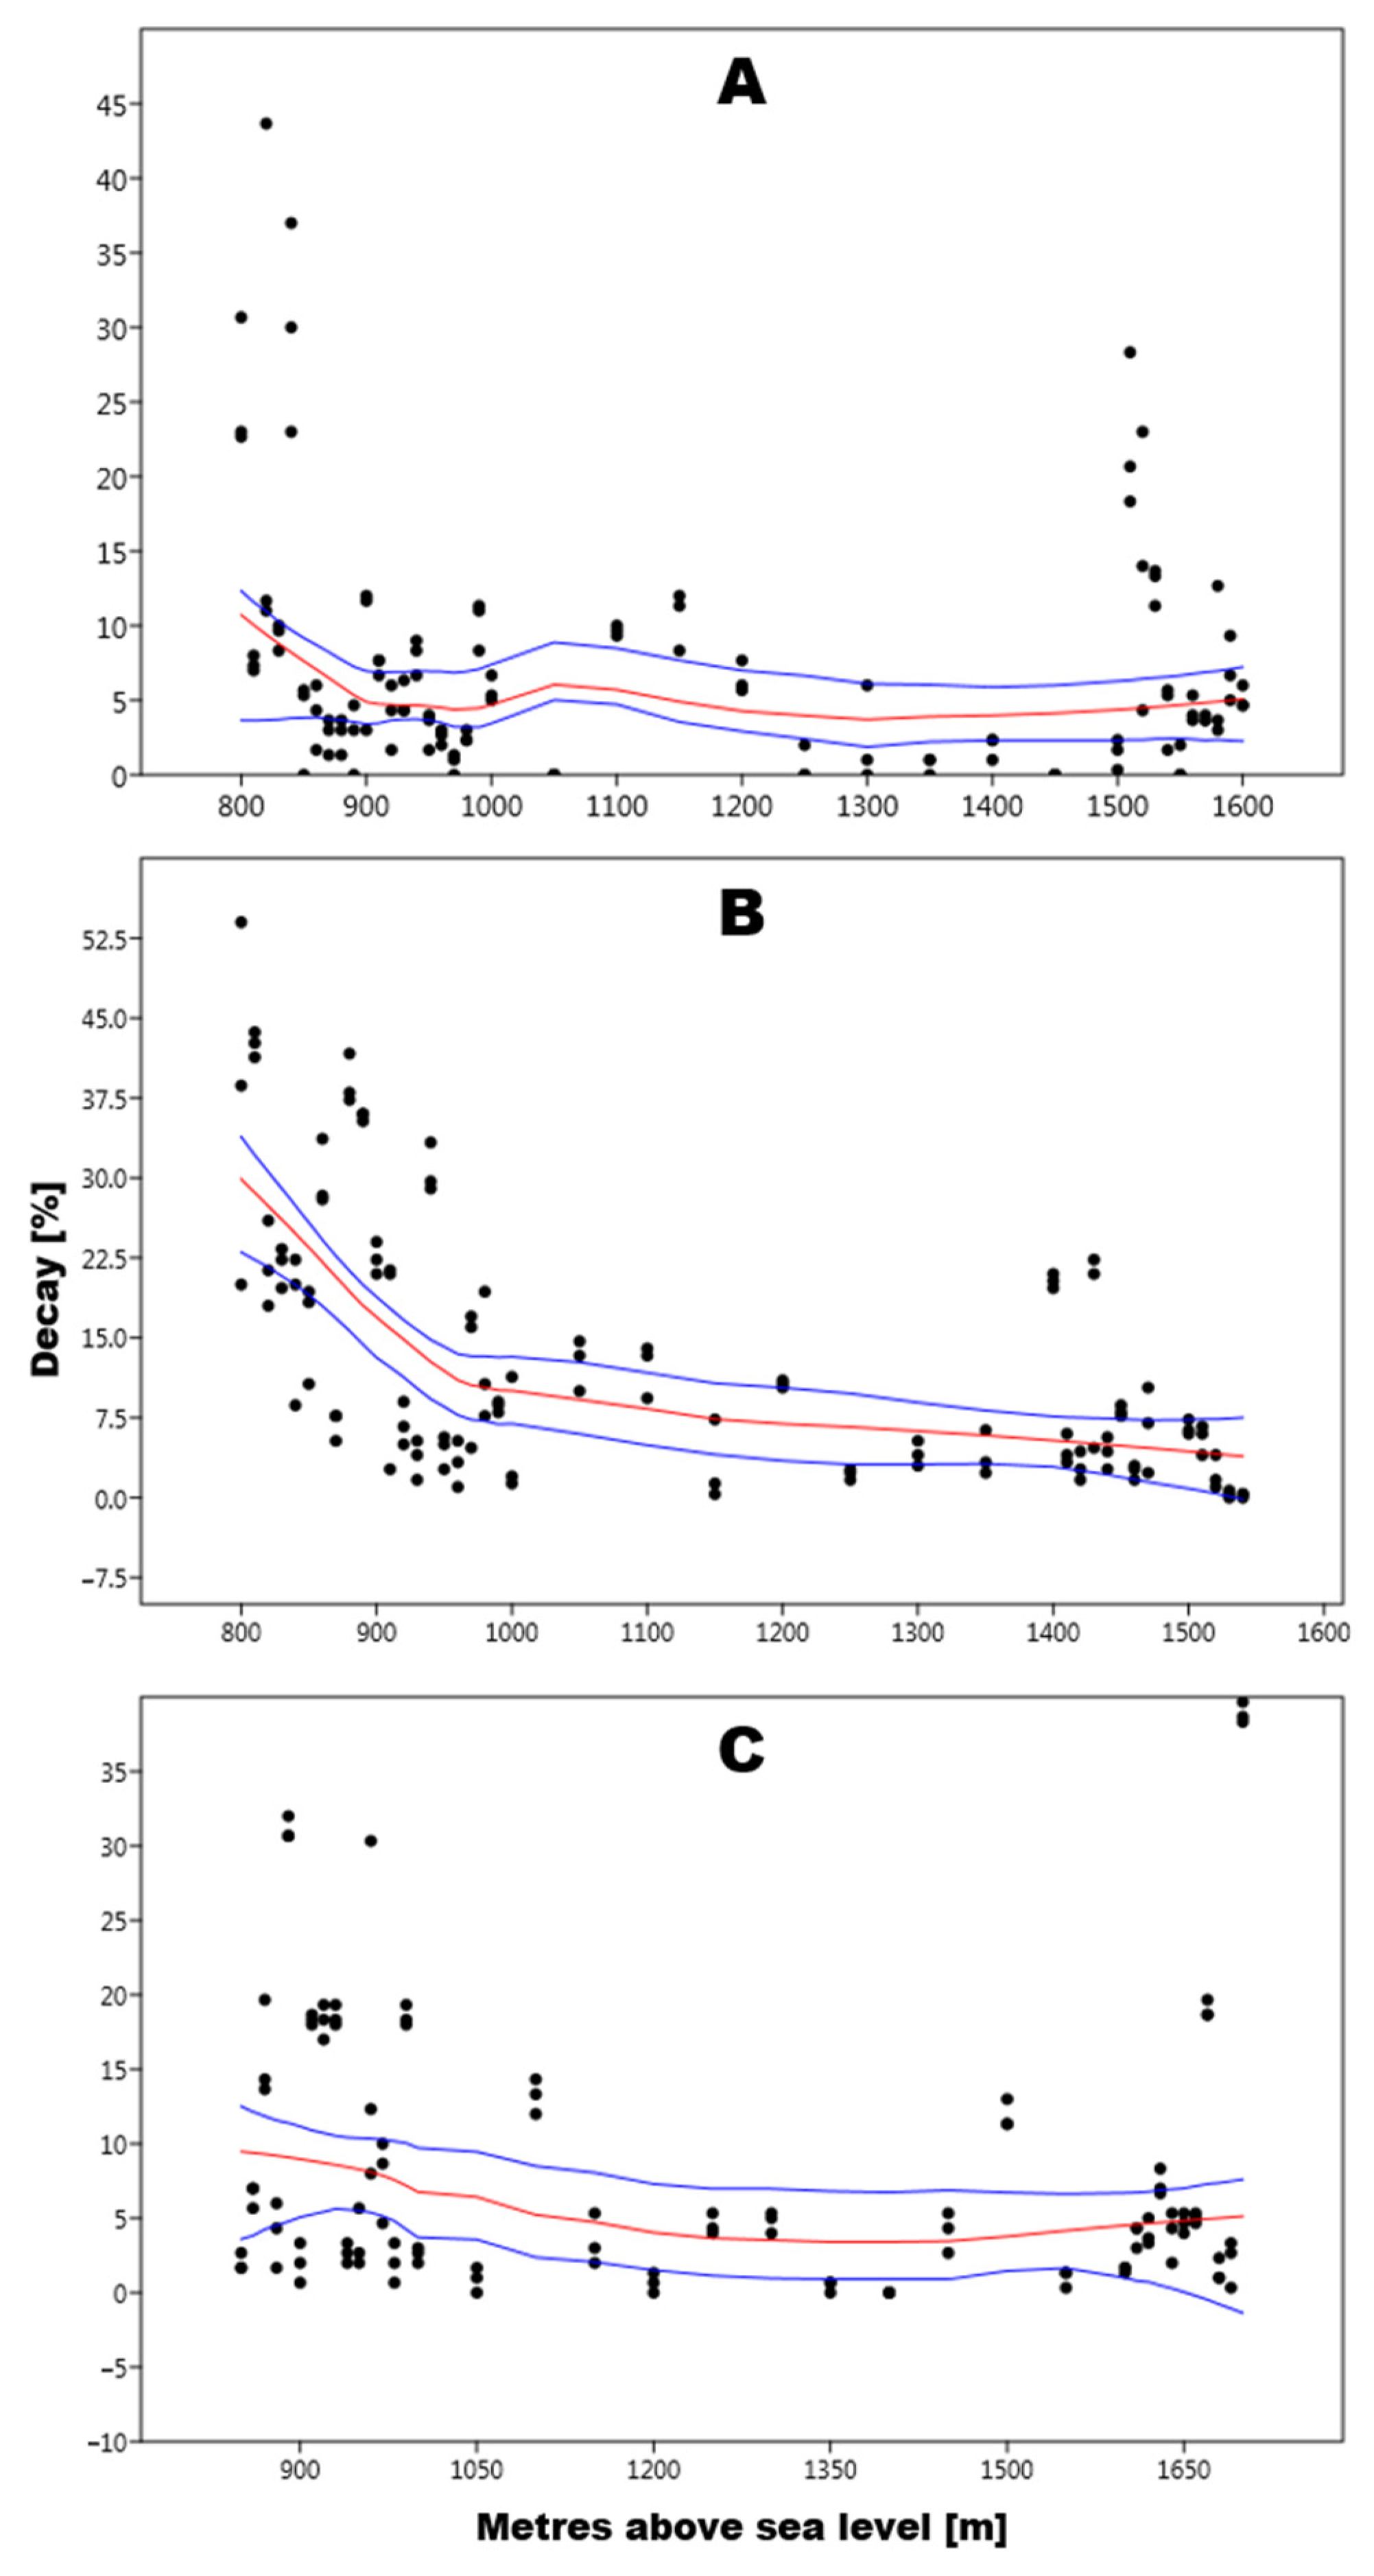
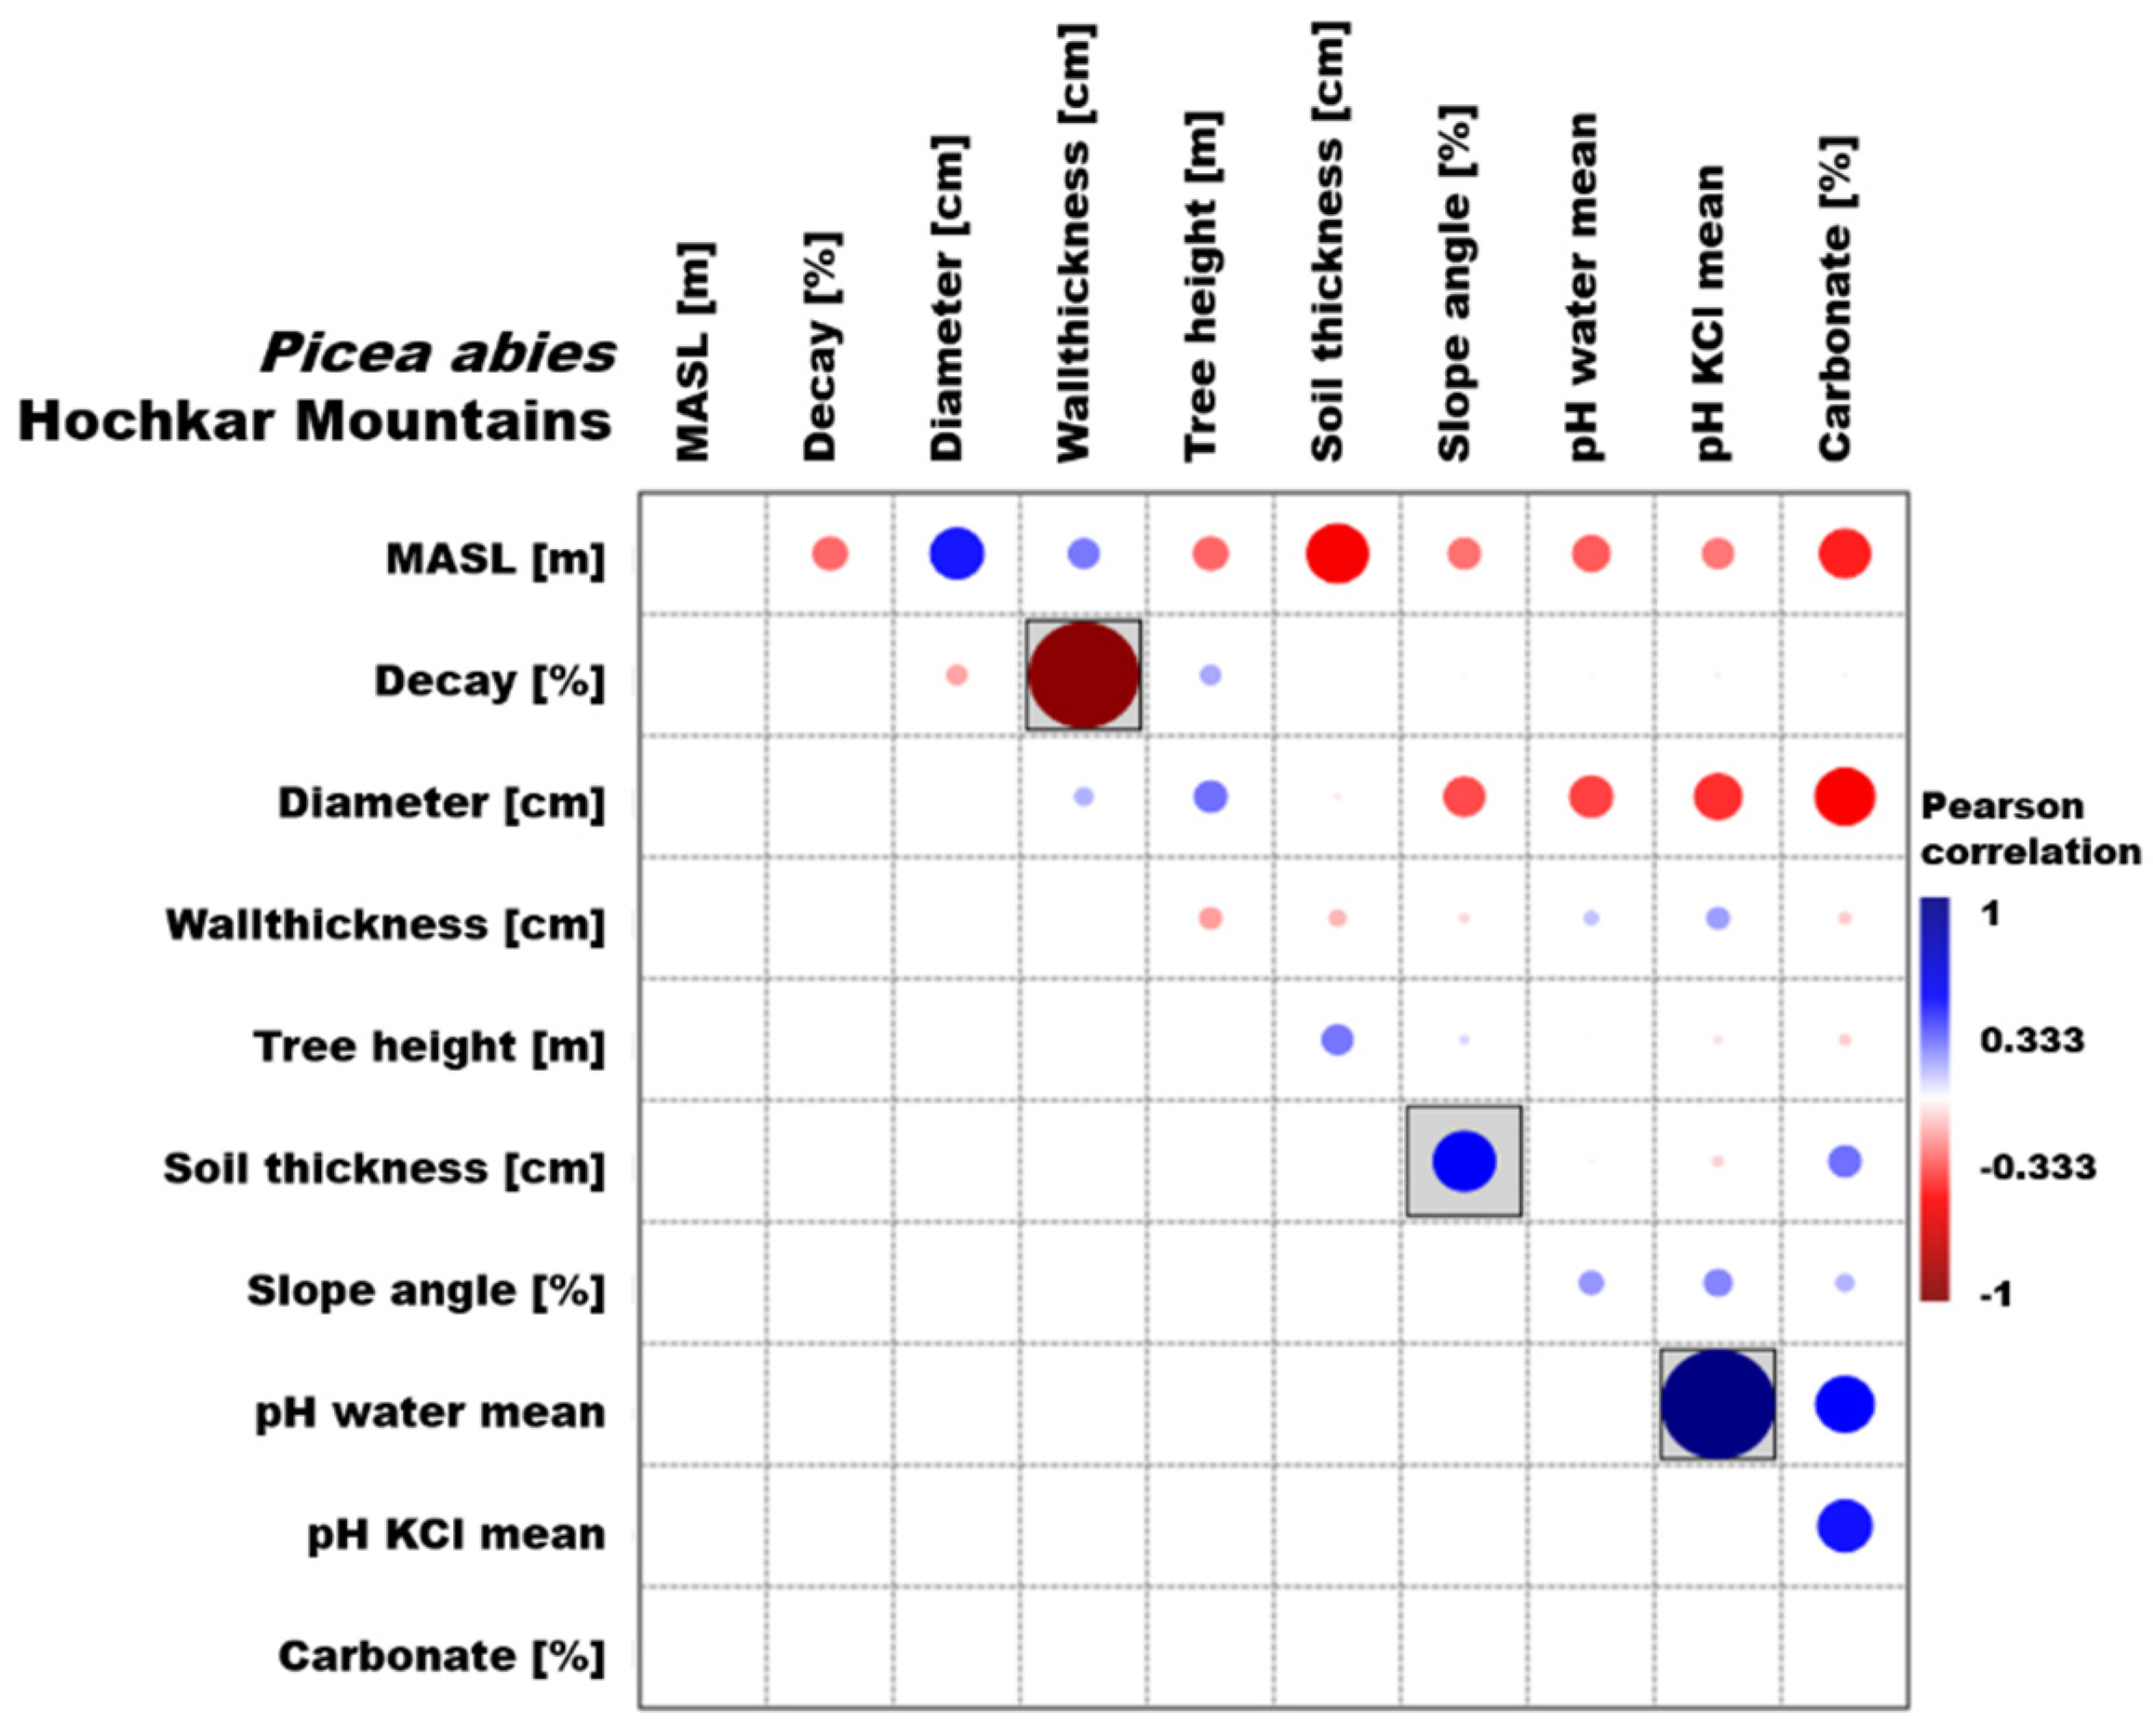
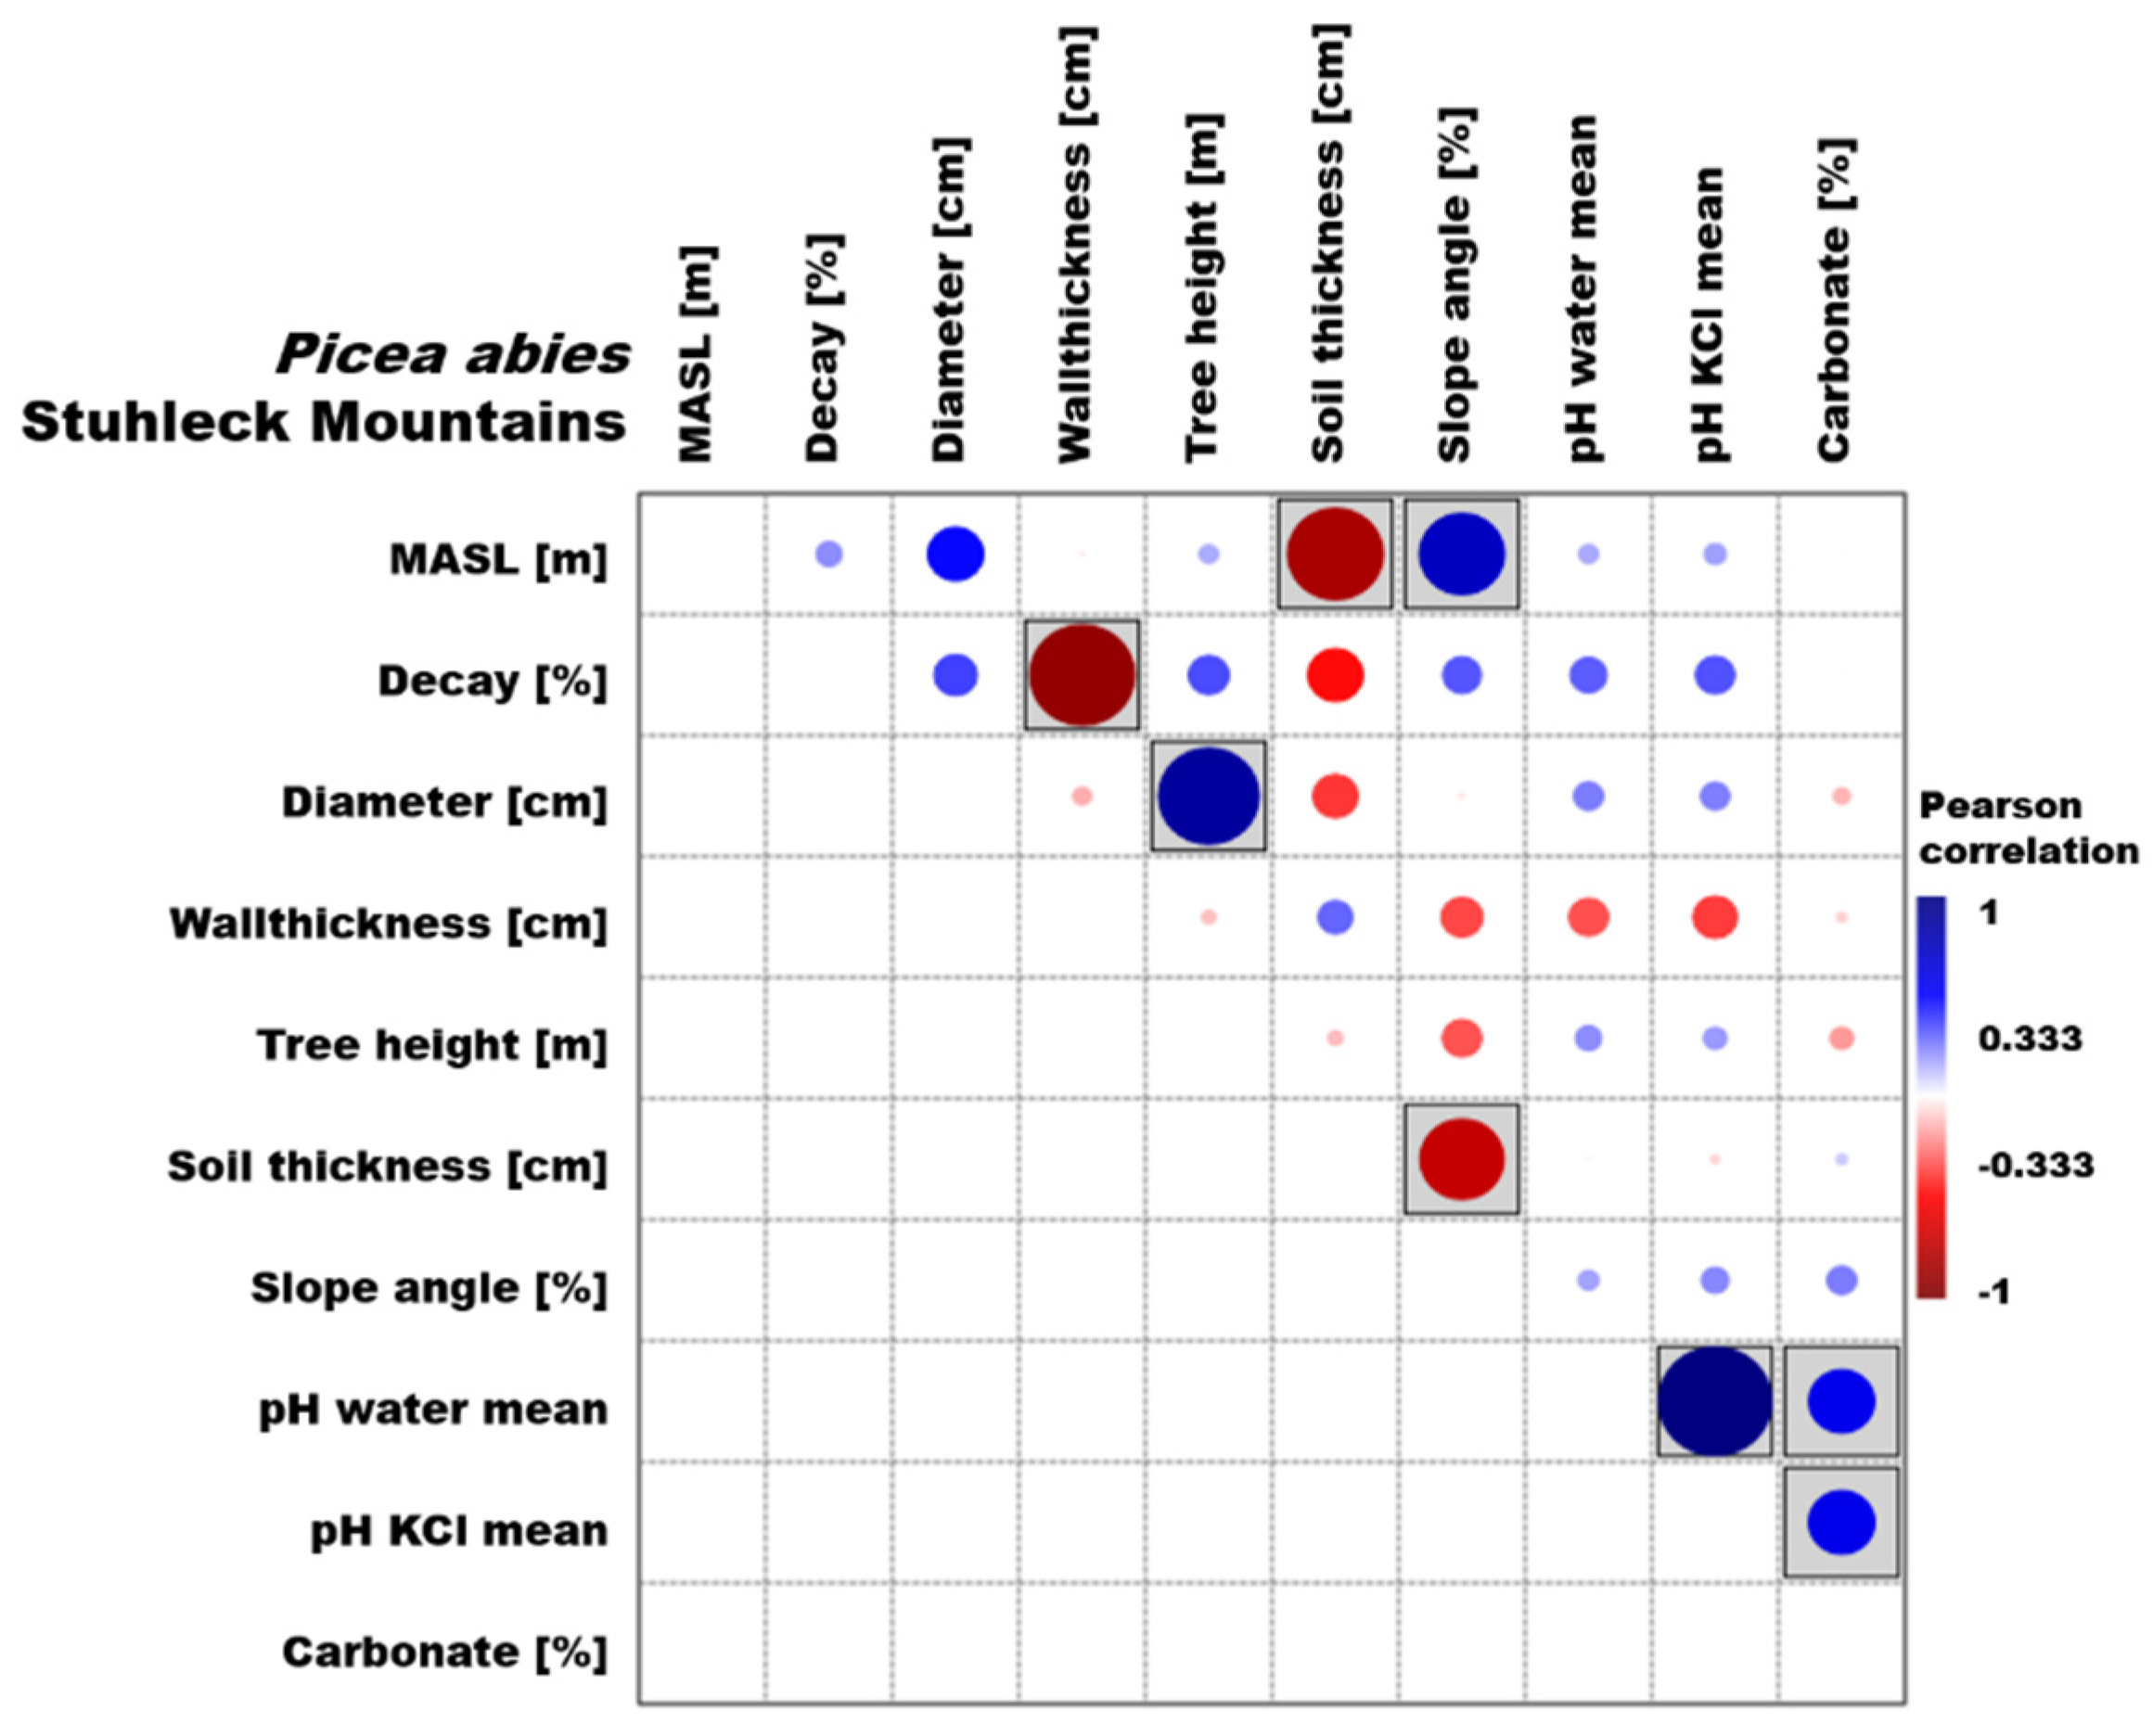
3.1. Picea Abies
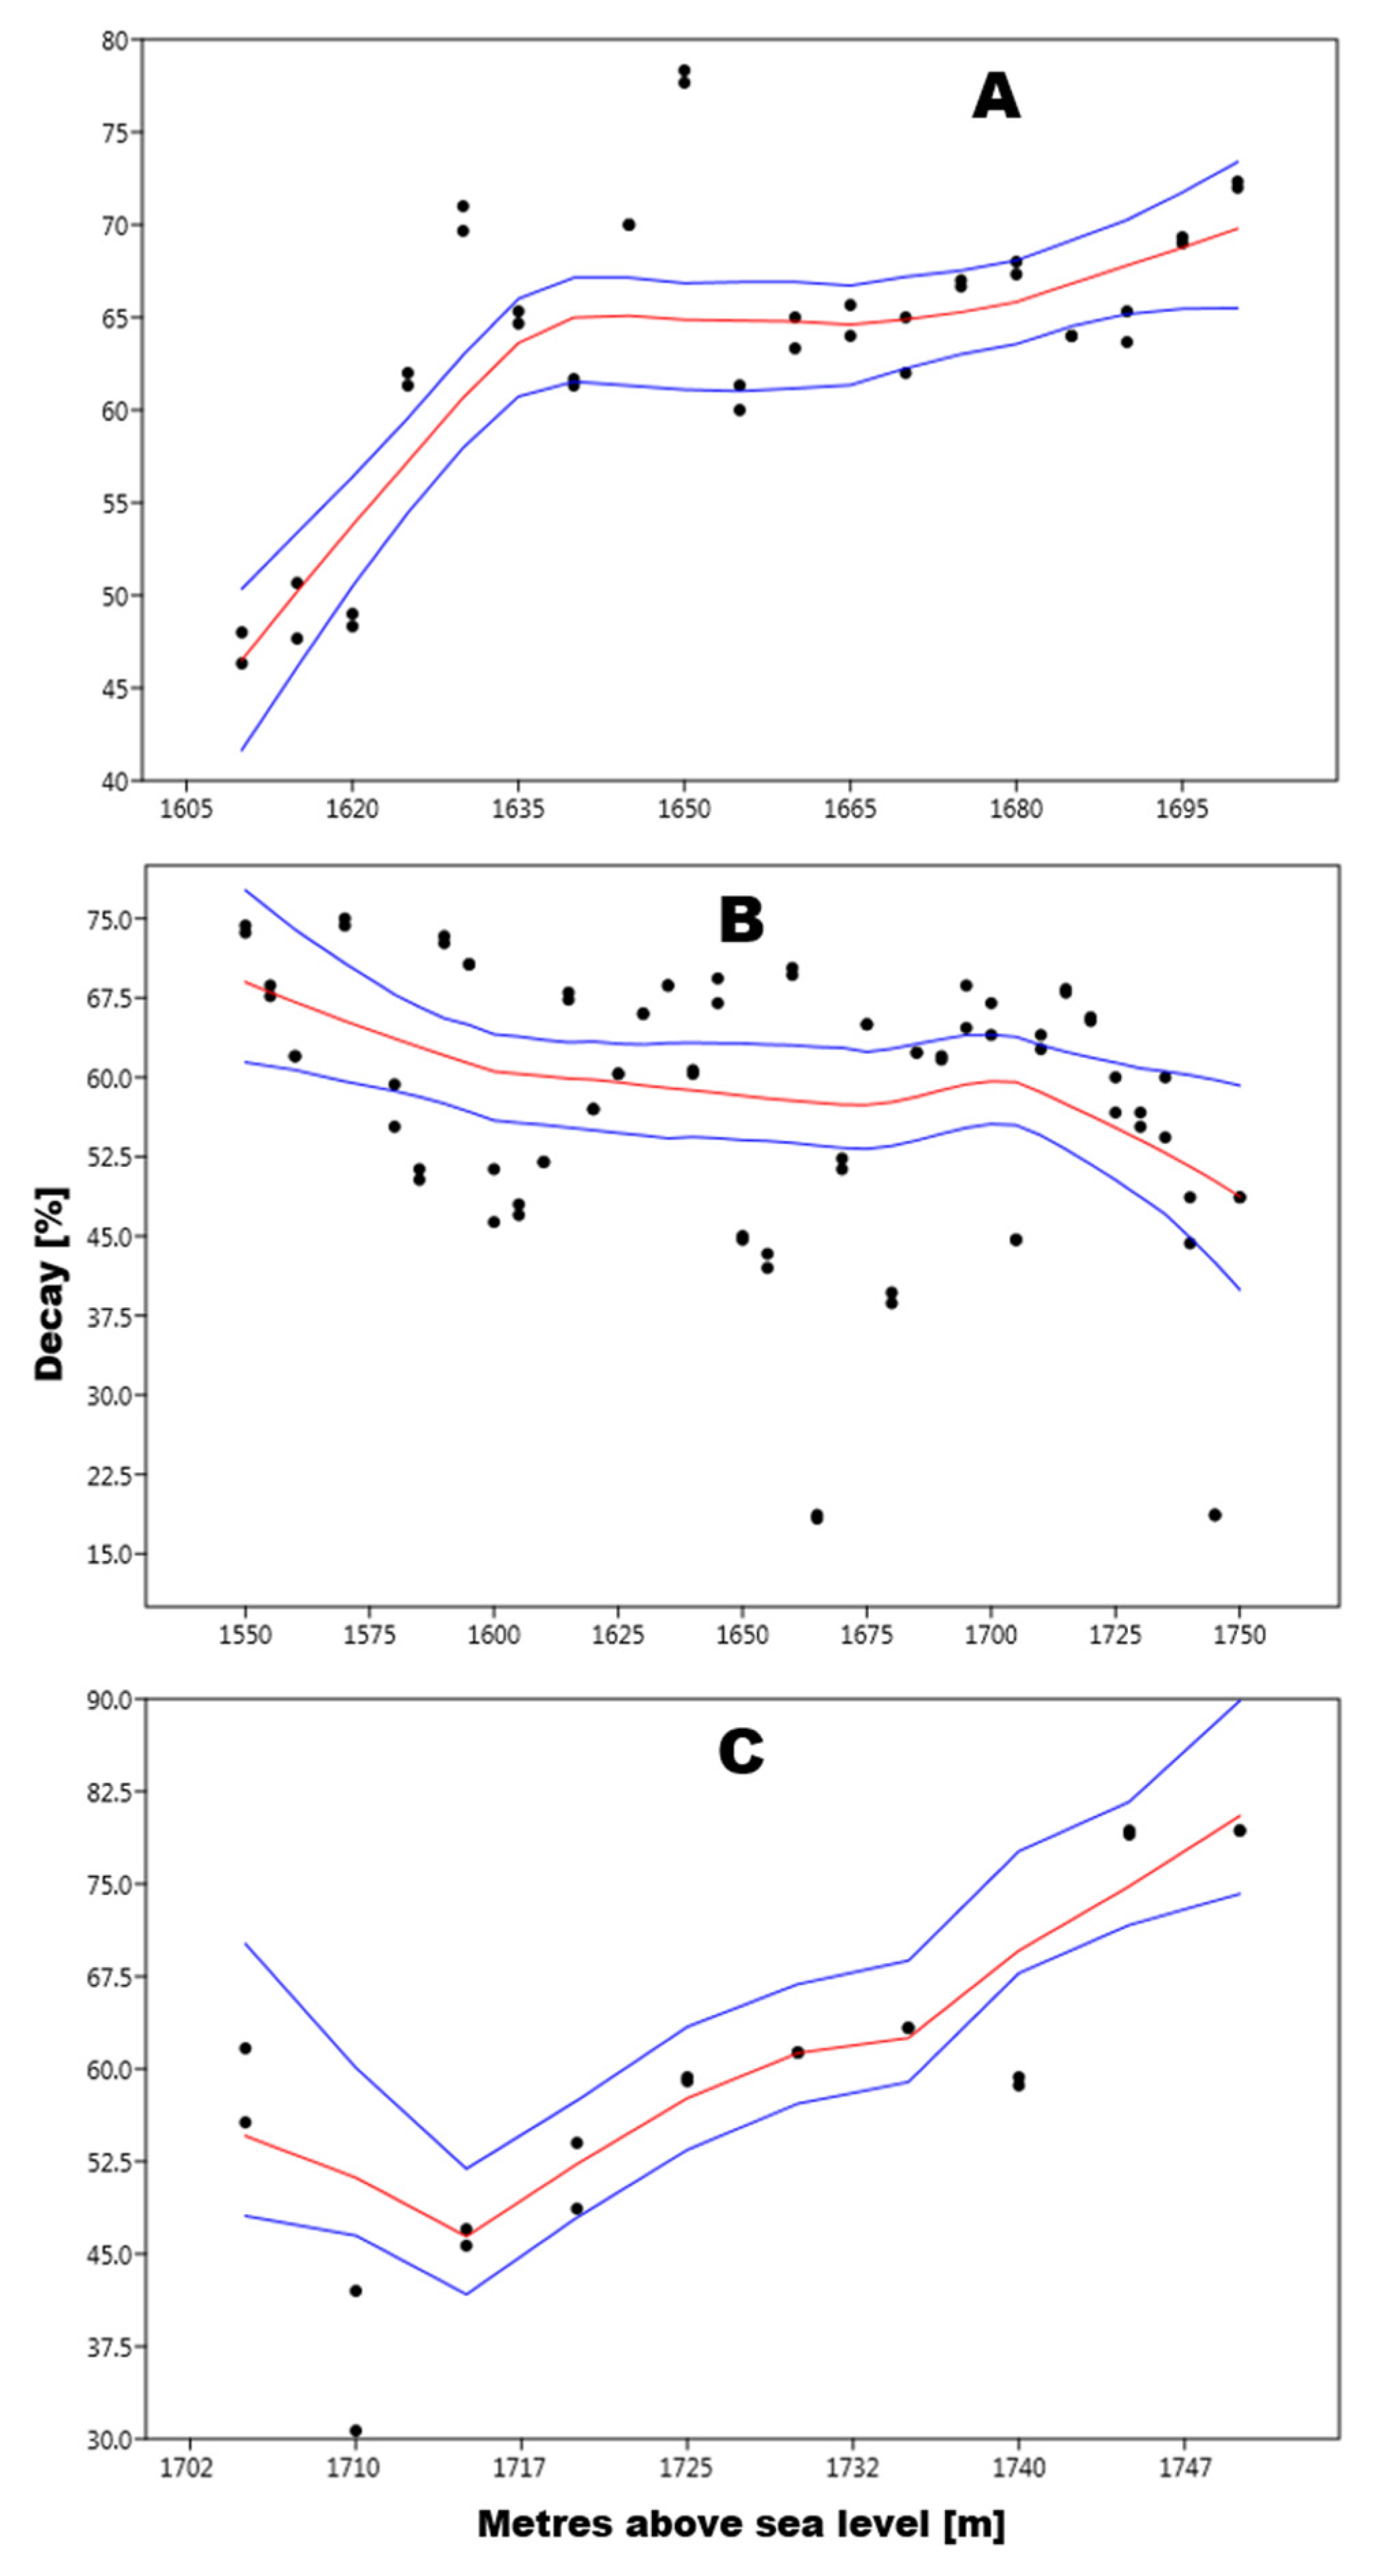
3.2. Pinus Mugo
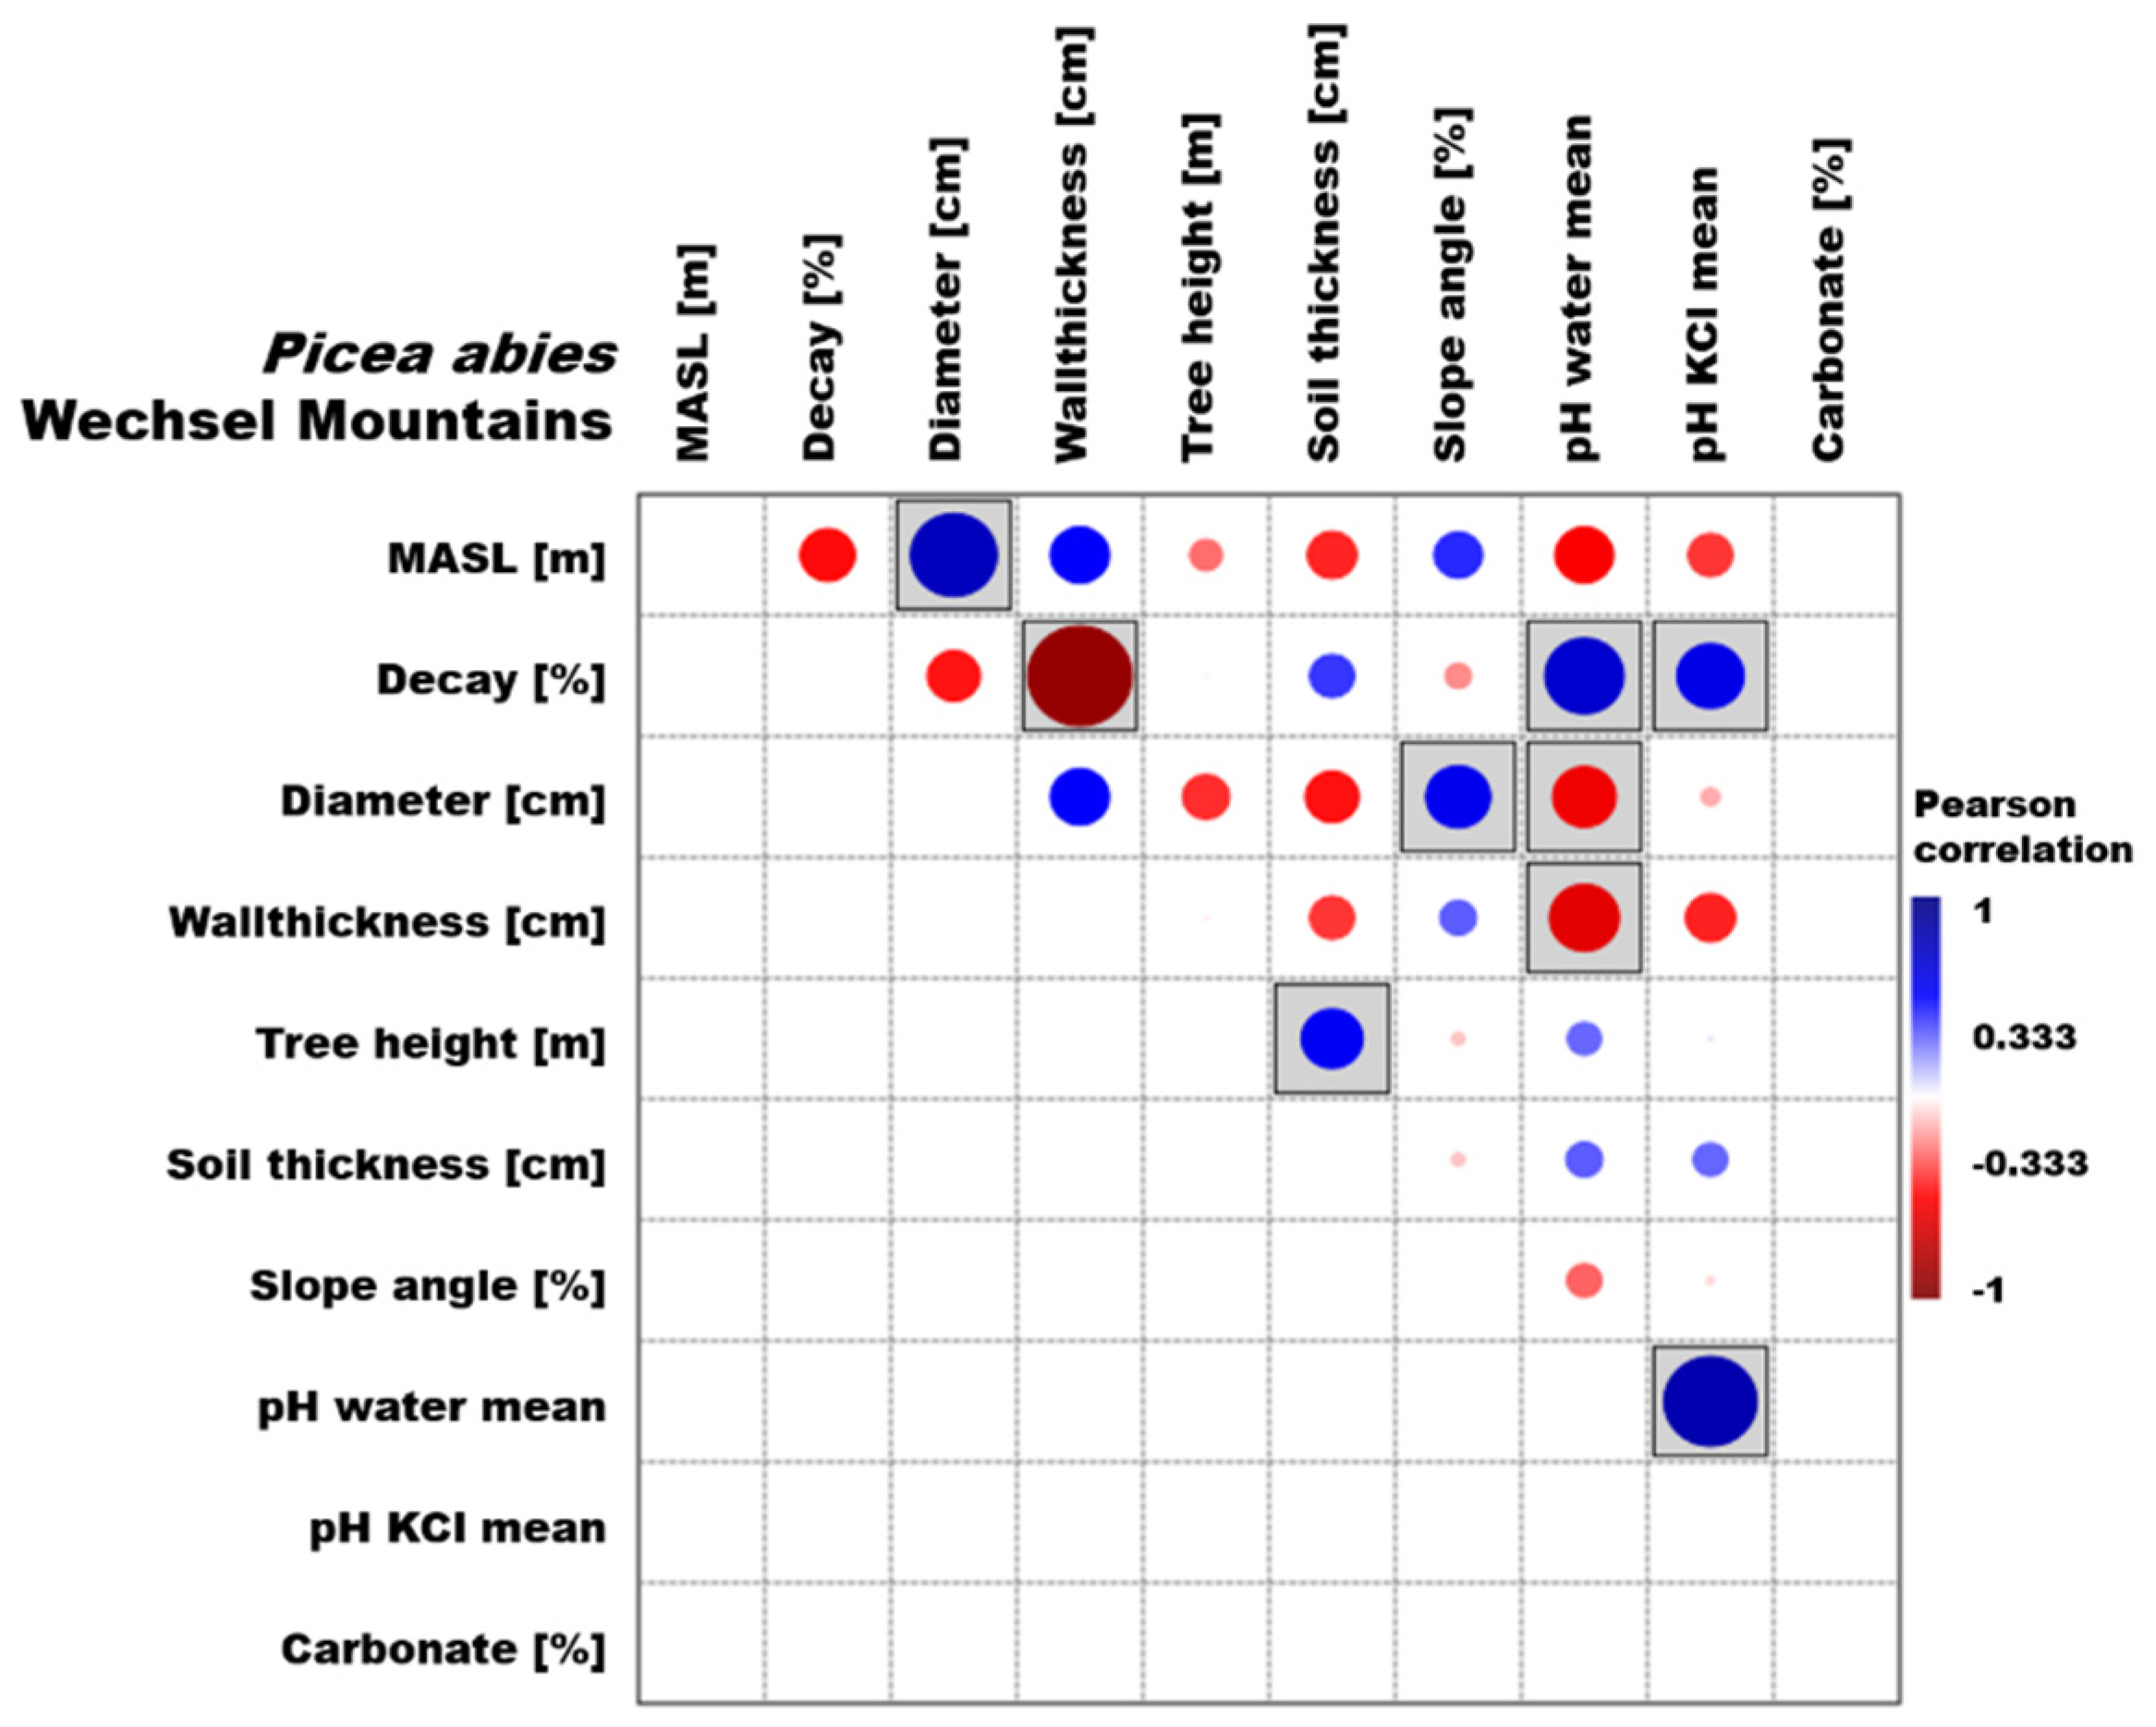
3.3. Environmental Parameters
4. Discussion
4.1. Picea Abies
4.2. Pinus Mugo
4.3. Environmental Parameters
4.4. General Discussion
5. Conclusions
Author Contributions
Funding
Data Availability Statement
Acknowledgments
Conflicts of Interest
References
- Fourth Assessment Report of Intergovermental Panel on Climate Change. Available online: http://www.ipcc.ch (accessed on 10 April 2021).
- Nogués-Bravo, D.; Araújo, M.B.; Errea, M.P.; Martínez-Rica, J.P. Exposure of global mountain systems to climate warming during the 21st Century. Glob. Environ. Chang. 2007, 17, 420–428. [Google Scholar] [CrossRef]
- Wipf, S.; Stöckli, V.; Herz, K.; Rixen, C. The oldest monitoring site of the Alps revisited: Accelerated increase in plant species richness on Piz Linard summit since 1835. Plant Ecol. Divers. 2013, 6, 447–455. [Google Scholar] [CrossRef]
- Pepin, N.; Bradley, R.; Diaz, H. Elevation-dependent warming in mountain regions of the world. Nat. Clim. Chang. 2015, 5, 424–430. [Google Scholar] [CrossRef] [Green Version]
- Máliš, F.; Kopecký, M.; Petřík, P.; Vladovič, J.; Merganič, J.; Vida, T. Life stage, not climate change, explains observed tree range shifts. Glob. Chang. Biol. 2016, 22, 1904–1914. [Google Scholar] [CrossRef] [PubMed] [Green Version]
- Defila, C.; Clot, B. Phytophenological trends in the Swiss Alps, 1951–2002. Meteorol. Z. 2005, 14, 191–196. [Google Scholar] [CrossRef]
- Le Climat Change–Que Faire? Le Nouveau Rapport des Nations Unies sur le Climat (GIEC 2007) et ses Principaux Résultats dans L’optique de la Suisse. Available online: http://proclimweb.scnat.ch/portal/ressources/854.pdf (accessed on 10 April 2021).
- Lenoir, J.; Gegout, J.C.; Marquet, P.A.; de Ruffray PBrisse, H. A significant upward shift in plant species optimum elevation during the 20th century. Science 2008, 320, 1768–1771. [Google Scholar] [CrossRef] [PubMed]
- Liang, E.; Wang, Y.; Piao, S.; Lu, X.; Camarero, J.J.; Zhu, H.; Zhu, L.; Ellison, A.M.; Ciais, P.; Peñuelas, J. Species interactions slow warming-induced upward shifts of treelines on the Tibetan Plateau. Proc. Natl. Acad. Sci. USA 2016, 113, 4380–4385. [Google Scholar] [CrossRef] [PubMed] [Green Version]
- Vittoz, P.; Cherix, D.; Gonseth, Y.; Lubini, V.; Maggini, R.; Zbinden, N.; Zumbach, S. Climate change impacts on biodiversity in Switzerland: A review. J. Nat. Conserv. 2013, 21, 154–162. [Google Scholar] [CrossRef]
- Bussotti, F.; Pollastrini, M.; Holland, V.; Brüggemann, W. Functional traits and adaptive capacity of European forests to climate change. Environ. Exp. Bot. 2015, 111, 91–113. [Google Scholar] [CrossRef]
- Mátyás, C.; Kramer, K. Adaptive management of forests and their genetic resources in the face of climate change. Erdészettudományi Közlemények 2016, 6, 7–16, (In Hungarian with English Summary). [Google Scholar] [CrossRef] [Green Version]
- D’Arrigo, R.D.; Kaufmann, R.K.; Davi, N.; Jacoby, G.C.; Laskowski, C.; Myneni, R.B.; Cherubini, P. Thresholds for warming-induced growth decline at elevational tree line in the Yukon Territory, Canada. Glob. Biogeochem. Cycles 2004, 18, 3021. [Google Scholar] [CrossRef]
- Dolezal, J.; Altman, J.; Vetrova, V.P.; Hara, T. Linking two centuries of tree growth and glacier dynamics with climate changes in Kamchatka. Clim. Chang. 2014, 124, 207–220. [Google Scholar] [CrossRef]
- Trenyik, P.; Skutai, J.; Szirmai, O.; Czóbel, S. Instrumental analysis of health status of Quercus petraea stands in the Carpathian Basin. Central Eur. For. J. 2019, 65, 34–40. [Google Scholar] [CrossRef] [Green Version]
- Holuša, J.; Lubojacký, J.; Čurn, V.; Tonka, T.; Lukášová, K.; Horák, J. Combined effects of drought stress and Armillaria infection on tree mortality in Norway spruce plantations. Forest Ecol. Manag. 2018, 427, 434–445. [Google Scholar] [CrossRef]
- Savva, Y.; Oleksyn, J.; Reich, P.B.; Tjoelker, M.G.; Vaganov, E.A.; Modrzynski, J. Interannual growth response of Norway spruce to climate along an altitudinal gradient in the Tatra Mountains, Poland. Trees 2006, 20, 735–746. [Google Scholar] [CrossRef]
- Hilmers, T.; Avdagić, A.; Bartkowicz, L.; Bielak, K.; Binder, F.; Bončina, A.; Dobor, L.; Forrester, D.I.; Hobi, M.L.; Ibrahimspahić, A.; et al. The productivity of mixed mountain forests comprised of Fagus sylvatica, Picea abies, and Abies alba across Europe. Int. J. For. Res. 2019, 92, 512–522. [Google Scholar] [CrossRef] [Green Version]
- Falk, W.; Hempelmann, N. Species Favourability Shift in Europe due to Climate Change: A Case Study for Fagus sylvatica L. and Picea abies (L.) Karst. Based on an Ensemble of Climate Models. Int. J. Climat. 2013, 2013, 787250. [Google Scholar] [CrossRef] [Green Version]
- Sáenz-Romero, C.; Kremer, A.; Nagy, L.; Újvári-Jármay, É.; Ducousso, A.; Kóczán-Horváth, A.; Hansen, J.K.; Mátyás, C. Common garden comparisons confirm inherited differences in sensitivity to climate change between forest tree species. PeerJ 2019, 7, e6213. [Google Scholar] [CrossRef]
- Matthias, J.; Bugmann, H.; Nötzli, M.; Bigler, C. Among-tree variability and feedback effects result in different growth responses to climate change at the upper treeline in the Swiss Alps. Ecol. Evol. 2017, 7, 7937–7953. [Google Scholar] [CrossRef]
- Juráň, S.; Šigut, L.; Holub, P.; Fares, S.; Klem, K.; Grace, J.; Urban, O. Ozone flux and ozone deposition in a mountain spruce forest are modulated by sky conditions. Sci. Total Environ. 2019, 672, 296–304. [Google Scholar] [CrossRef]
- Chropeňová, M.; Gregušková, E.K.; Karásková, P.; Přibylová, P.; Kukučka, P.; Baráková, D.; Čupr, P. Pine needles and pollen grains of Pinus mugo Turra–A biomonitoring tool in high mountain habitats identifying environmental contamination. Ecol. Indic. 2016, 66, 132–142. [Google Scholar] [CrossRef]
- Divós, F.; Divós, P. Resolution of stress wave based Acoustic Tomography. In Proceedings of the 14th International Symposium on Nondestructive Testing of Wood; Broker, F.-W., Ed.; Shaker Verlag: Aachen, Germany, 2005; pp. 309–314. [Google Scholar]
- Divós, F.; Dénes, L.; Iniguez, G. Effect of crosssectional change of a board specimen on stress wave velocity determination. Holzforschung 2005, 59, 230–231. [Google Scholar] [CrossRef]
- Trenyik, P.; Ficsor, C.; Demeter, A.; Falvai, D.; Czóbel, S. Examination the health state with instrumental measurements and the diversity of sessile oak stands in Zemplén mountains. Columella 2017, 4, 21–30. [Google Scholar] [CrossRef]
- Buzás, I. Soil and agrochemical test method book 2. Physico-chemical and chemical test methods for soils. Agrokémia Talajt. 1989, 38, 504–505. (In Hungarian) [Google Scholar]
- Hammer, Ø. PAST–PAleontological STatictics Version 3.06 Reference Manual; Natural History Museum–University of Oslo: Oslo, Norway, 1999–2015; 225p. [Google Scholar]
- Hammer, Ø. PAST–PAleontological STatictics Version 4.05 Reference Manual; Natural History Museum–University of Oslo: Oslo, Norway, 1999–2021; 284p. [Google Scholar]
- Hammer, Ø.; Harper, D.A.T.; Ryan, P.D. PAST–Paleontological Statistics Software Package for Education and Data Analysis. Palaeontol. Electron. 2001, 4, 1–9. [Google Scholar]
- Falvai, D.; Baltazár, T.; Czóbel, S. Health status analysis of Norway spruce and shrubby pine along an elevation gradient. Columella 2019, 6, 29–36. [Google Scholar] [CrossRef]
- Falvai, D.; Baltazár, T.; Szegleti, Z.; Czóbel, S. Investigation of the health status of Picea abies and Pinus mugo tree species in the semi-natural forest stands of the Wechsel Mountains. Természetvédelmi Közlemények 2020, 26, 16–27, (In Hungarian with English Summary). [Google Scholar] [CrossRef]
- Cleveland, W.S. Robust locally weighted fitting and smoothing scatterplots. J. Am. Stat. Assoc. 1979, 74, 829–836. [Google Scholar] [CrossRef]
- Cleveland, W.S. A program for smoothing scatterplots by robust locally weighted fitting. Am. Stat. 1981, 35, 54. [Google Scholar] [CrossRef]
- Krejza, J.; Cienciala, E.; Světlík, J.; Bellan, M.; Noyer, E.; Horáček, P.; Štěpánek, P.; Marek, M.V. Evidence of climate-induced stress of Norway spruce along elevation gradient preceding the current dieback in Central Europe. Trees 2021, 35, 103–119. [Google Scholar] [CrossRef]
- Baker, B.B.; Moseley, R.K. Advancing treeline and retreating glaciers: Implications for conservation in Yunnan, PR China. Arct. Antarct. Alp. Res. 2007, 39, 200–209. [Google Scholar] [CrossRef] [Green Version]
- Cazzolla Gatti, R.; Callaghan, T.; Velichevskaya, A.; Dudko, A.; Fabbio, L.; Battipaglia, G.; Liang, J. Accelerating upward treeline shift in the Altai Mountains under last-century climate change. Sci. Rep. 2019, 9, 7678. [Google Scholar] [CrossRef] [PubMed]
- Jump, A.S.; Mátyás, C.S.; Peñuelas, J. The altitude-for-latitude disparity in the range retractions of woody species. Trends Ecol. Evol. 2009, 24, 694–701. [Google Scholar] [CrossRef] [PubMed] [Green Version]


| Decay | W-PA-40 | W-PA-80 | W-PA-120 | W-PM-20 | W-PM-40 | H-PA-40 | H-PA-80 | H-PA-120 | H-PM-20 | H-PM-40 | S-PA-40 | S-PA-80 | S-PA-120 | S-PM-20 | S-PM-40 |
|---|---|---|---|---|---|---|---|---|---|---|---|---|---|---|---|
| N | 41 | 41 | 41 | 19 | 19 | 41 | 41 | 41 | 39 | 39 | 38 | 38 | 38 | 10 | 10 |
| Min | 0.00 | 0.00 | 0.00 | 46.33 | 47.67 | 0.33 | 0.33 | 0.00 | 18.67 | 18.33 | 0.00 | 0.00 | 0.00 | 42.00 | 30.67 |
| Max | 30.67 | 37.00 | 43.67 | 77.67 | 78.33 | 54.00 | 42.67 | 41.67 | 74.33 | 75.00 | 38.33 | 39.67 | 38.67 | 79.33 | 79.33 |
| Mean | 6.81 | 6.42 | 7.42 | 63.53 | 63.74 | 14.15 | 13.22 | 10.83 | 57.59 | 57.42 | 8.64 | 7.60 | 8.03 | 60.67 | 58.13 |
| Std. error | 1.07 | 1.13 | 1.40 | 1.80 | 1.87 | 2.02 | 1.86 | 1.77 | 2.09 | 2.13 | 1.52 | 1.47 | 1.44 | 3.78 | 4.63 |
| Variance | 47.10 | 52.56 | 80.31 | 61.90 | 66.60 | 166.73 | 141.82 | 128.88 | 170.46 | 176.43 | 88.35 | 82.44 | 78.67 | 143.16 | 214.24 |
| Stand. dev | 6.86 | 7.25 | 8.96 | 7.87 | 8.16 | 12.91 | 11.91 | 11.35 | 13.06 | 13.28 | 9.40 | 9.08 | 8.87 | 11.96 | 14.64 |
| Median | 5.33 | 4.33 | 4.33 | 64.00 | 65.00 | 9.33 | 8.67 | 7.33 | 60.67 | 60.33 | 4.84 | 4.17 | 4.67 | 60.33 | 58.84 |
| 25 prcntil | 3.00 | 1.50 | 2.33 | 61.33 | 61.67 | 4.00 | 3.67 | 2.67 | 51.33 | 48.67 | 2.50 | 1.67 | 2.00 | 52.25 | 47.92 |
| 75 prcntil | 8.33 | 9.50 | 9.00 | 69.00 | 69.33 | 22.33 | 21.17 | 16.00 | 67.00 | 68.33 | 14.33 | 12.08 | 13.08 | 67.33 | 67.25 |
Publisher’s Note: MDPI stays neutral with regard to jurisdictional claims in published maps and institutional affiliations. |
© 2021 by the authors. Licensee MDPI, Basel, Switzerland. This article is an open access article distributed under the terms and conditions of the Creative Commons Attribution (CC BY) license (https://creativecommons.org/licenses/by/4.0/).
Share and Cite
Falvai, D.; Saláta, D.; Baltazár, T.; Czóbel, S. Instrumental Study of the Health Status of Picea abies [L.] Karst and Pinus mugo (Turra) and Their Relation to Environmental Parameters in the Eastern Alps. Forests 2021, 12, 716. https://doi.org/10.3390/f12060716
Falvai D, Saláta D, Baltazár T, Czóbel S. Instrumental Study of the Health Status of Picea abies [L.] Karst and Pinus mugo (Turra) and Their Relation to Environmental Parameters in the Eastern Alps. Forests. 2021; 12(6):716. https://doi.org/10.3390/f12060716
Chicago/Turabian StyleFalvai, Dominika, Dénes Saláta, Tivadar Baltazár, and Szilárd Czóbel. 2021. "Instrumental Study of the Health Status of Picea abies [L.] Karst and Pinus mugo (Turra) and Their Relation to Environmental Parameters in the Eastern Alps" Forests 12, no. 6: 716. https://doi.org/10.3390/f12060716