
Plant Traits of Tilia tomentosa Moench, Fraxinus excelsior L., and Pinus nigra J.F.Arnold as a Proxy of Urbanization

1
Department of Ecology and Environmental Conservation, Faculty of Biology, University of Plovdiv “Paisii Hilendarski”, 24 Tzar Asen Str., 4000 Plovdiv, Bulgaria
2
Department of Microbiology and Ecological Biotechnologies, Faculty of Plant Protection and Agroecology, Agricultural University, 12 Mendeleev Blvd., 4000 Plovdiv, Bulgaria
*
Author to whom correspondence should be addressed.
Forests 2023, 14(4), 800; https://doi.org/10.3390/f14040800
Submission received: 22 March 2023
/
Revised: 10 April 2023
/
Accepted: 11 April 2023
/
Published: 13 April 2023
(This article belongs to the Special Issue The Response of Trees to Air Pollution in Urban Forests)
Abstract
:Linden, ash, and pine are ubiquitous ornamental trees due to their ability to adapt to the urban environment. They have been key species in urban green infrastructure from more than hundreds of years and play an active role in maintaining ecosystem services. The urbanization rate in recent decades, combined with global climate change, has led to dynamic changes in the environmental factors which pose new challenges to urban vegetation. Hence, the aims of this study were as follows: (i) to track changes in the content of some elements in plant leaves after transplanting them into an urban environment; (ii) to investigate the relationship between urbanization intensity with plant traits (leaf injuries, photosynthetic activity, transpiration, stomatal conductance, and molecular changes); and (iii) to provide recommendations for improving the management and ecological functions of urban trees. To address these aims, data on urbanization intensity (according to the percentage of built-up area and traffic volume), plant performance, and intraspecific variations of silver linden (Tilia tomentosa), European ash (Fraxinus excelsior), and European black pine (Pinus nigra) were collected at four experimental plots in the city of Plovdiv (Bulgaria) during 2015–2020. The initial concentrations of some potentially toxic elements (As, Cd, Cr, Cu, Mn, Pb, V, and Zn) in the tree leaves at the beginning (prior to planting into the urban environment) and at the end of the experiment were also measured. We illustrate that the growth of urbanization intensity increased the concentrations of potentially toxic elements in tree leaves, caused leaf injuries, and enhanced the maximum photosynthetic rate but decreased the transpiration rate and stomatal conductance. At the molecular level, the percentage of polymorphic bands was also found to depend on urbanization intensity. High similarity was observed between the trees in the first three experimental plots (subjected to urbanization load), with the lowest similarity in the control plot. These findings are of high practical value for urban planners regarding how to build a new green infrastructure and how to preserve plant diversity in urban areas across urbanization gradients.
Keywords:
linden; ash; pine; functional traits; molecular markers; urban trees; heavy metals; environmental pollution1. Introduction
The urbanization rate in recent decades, combined with global climate change, has led to dynamic changes in the environmental factors of human settlements, which pose new challenges to urban vegetation [1,2]. Heat islands, a higher albedo of buildings’ surfaces, lower moisture, and significant pollution of both air and soil with potentially toxic elements (PTEs) represent a small number of all negative effects in the urban landscape to green infrastructure [3]. The transport of chemical elements from the abiotic to the biotic environment by urban vegetation is one of the vital ecosystem processes [4]. Urban trees effectively filter gaseous air pollutants and dust particles from the ambient air due to their large surface area. So, they have to adapt in a way that maximizes their productivity and helps plants tolerate a wider range of urbanization’s intensity influence [5]. Furthermore, environmental differences within and between urban and rural areas may reveal adaptive divergence among plant populations [6]. These adaptations can be defined as plant functional traits and can be quantified as physiological proxies to environmental stresses [5,7,8,9]. Plant traits correlate strongly across tree species in different types of environments and include various parameters at the anatomical [10], morphological [11], physiological [11], and molecular levels [12].
Younger trees are found to be more sensitive to external influences due to their smaller root systems and crowns [13,14]. Furthermore, the most vulnerable are the saplings, which are grown under controlled conditions in greeneries and then planted in the cities, where the newly planted trees have to address the combined stress of both relocation and anthropogenic impacts. Stress in plants can be defined as any change that occurs in the environment and leads to a violation of metabolic homeostasis [15]. Exposure of plants to adverse environmental conditions causes oxidative stress, which is the result of the accumulation of reactive oxygen species (ROS) in various cell compartments. Accumulated ROS cause oxidative damage in the plant cell and can serve as signaling molecules involved in the control of various cellular processes. The balance between the production and disposal of accumulated ROS is ensured by a complex network including antioxidant enzymes, non-enzymatic antioxidant molecules, and ROS-producing enzymes. It is also probably associated with changes in the gene expression of these enzymes, as well as the expression of a number of other genes, many of which are markers for a specific type of stress [16].
Morphological and physiological behaviors of urban trees and their adaptation to urban pressures have been well studied in comparison with their responses at a molecular or genetic level. Tree species or genotypes do not respond in the same manner to these constraints, and this response may change with age [11]. Different molecular biology tools have been applied. Species boundaries amongst North American Tilia have been studied by phylogenetic analysis of plastid DNA sequences [17]. Nuclear markers such as microsatellite repeated sequences were characterized in T. platyphyllos and then used to test for cross amplification in 23 species in the Tilia genus [18]. The large number of copies of retrotransposons in eukaryotic genomes, as well as the relative conservatism of important sequences, allow them to serve as a basis for molecular marker systems. These marker systems are usually based on the amplification of fragments between the ends of retroelements and genomic DNA between them. Some commonly used PCR retrotransposon-based molecular markers include iPBS (inter-priming binding sites), SSR (simple sequence repeats), RBIP (retrotransposon-based insertional polymorphism), IRAP (inter-retrotransposon amplified polymorphism), and retrotransposon-microsatellite amplified polymorphism (REMAP) [19]. The iPBS primer construction method uses highly conserved regions of the PBS site for tRNA. iPBS analysis investigates the applicability of molecular marker systems based on mobile genetic elements (MGEs) to characterize induced genetic diversity in plants. MGE (DNA transposons and retrotransposons) are a valuable source of markers for studying genetic diversity at the DNA level. The involvement of MGE in chromosomal reconstruction is an important topic for elucidating the evolution of the plant genome [6]. At the same time, the modern understanding of MGE as epigenetic regulators of the genome defines them as a good tool for studying genomic stability and gene expression in response to biotic and abiotic stress in order to elucidate the adaptive and evolutionary mechanisms in plants.
Hence, the aims of this study were as follows: (i) to track changes in the content of some elements in plant leaves after transplanting them into an urban environment; (ii) to investigate the relationship between urbanization intensity with plant traits (leaf injuries, photosynthetic activity, transpiration, stomatal conductance, and molecular changes); and (iii) to provide recommendations for improving the management and ecological functions of urban trees. To address these aims, data on urbanization intensity (according to the percentage of built-up area and traffic volume), plant performance, and intraspecific variations of silver linden (T. tomentosa), European ash (F. excelsior), and European black pine (P. nigra) were collected at four experimental plots in the city of Plovdiv (Bulgaria) during 2015–2020.
2. Materials and Methods
2.1. Study Area
The city of Plovdiv (42°8′9.9492″ N; 24°44′31.8048″ E), Bulgaria, is located on the banks of the Maritsa River and covers 102 km2 area. The climate is humid subtropical (Köppen climate classification Cfa) with considerable humid continental influences. The average summer (July and August) temperature is 33 °C, and the average winter temperature (January) is −0.4 °C. The average relative humidity is 73%, and the total precipitation is 540 mm, fairly evenly distributed throughout the year. Plovdiv developed historically on seven syenite hills, some of which are 250 m high. They significantly affect the reallocation of climatic factors and contribute to the formation of specific microclimates. These topographic features, combined with the rate of city growth and traffic intensification, result in compromised quality of the urban environment, especially in terms of air pollution [20].
2.2. Urbanization Intensity Classification
During the spring of 2015 (April), standardized saplings (8 years old) of T. tomentosa, F. excelsior, and P. nigra were purchased from certified nursery and planted by our team at four experimental sites in the city of Plovdiv, each site having 5 individuals of each species per plot as a group planting (Figure 1). Four experimental plots were selected on the basis of typology of the urban environment they represent and the type of anthropogenic impact (Table 1). All plots were characterized by similar soil conditions (Fluvisol with anthropogenic-influenced upper horizons), pH, sun exposure, and a normal moistening regime [21]. They are situated to the NE, SE, SW, and NW of the city center, aiming to comprise areas with different traffic intensity and load, as follows: Plot 1—central part, NE direction, adjacent to a busy road junction with heavy traffic and a high level of air pollution; Plot 2—central part, SE direction, with moderate motor traffic and a medium level of air pollution; Plot 3—west suburb, SW direction, near a busy road junction with very heavy railroad and vehicle traffic; Plot 4—west suburb, NW direction, in a big park with very low traffic and a low level of air pollution (conditional control for urban environment).
Volume of the road traffic was assessed on the basis of the number of cars (or motorcycles) in a period of ten minutes at 8 a.m. on a working day [21]. Percentage of the built-up area within a 1 km2 area was quantified in ArcGis version 11 software using the City General Layout Plan (Municipality of Plovdiv). As these two features can be quantified in any urban environment, regardless of geographical, cultural, and historical variation, they represent an adequate proxy of urbanization intensity [22].
2.3. Plant Traits
Periodically observations were made on the saplings’ development, physiology, and health status through 2015–2020 [21]. Leaf samples for analyses were collected once per year (August). In order to obtain a homogeneous sample, a large number of one-year-old leaves, comparable in size and shape, were taken by hand from the branches, taking care to minimize contact with the leaf surface. Usually, 20–30 fully expanded leaves (needles) per tree were collected, and a composite sample was prepared for analysis. All the samples were stored in clean, labeled polyethylene bags closed tightly to avoid contamination during transport.
Four types of plant traits, representing plant response at four different levels, were analyzed as follows.
2.3.1. Concentrations of Potentially Toxic Elements (PTEs) in Tree Leaves/Needles
Concentrations of PTEs (As, Cd, Cr, Cu, Mn, Pb, V, Zn) in air-dried plant samples were estimated after MW digestion in closed PTFE vessels (ETHOS ONE, Milestone, Sorisole, Italy) by using a mixture of HNO3 + H2O2. All reagents used were high-purity analytical grade. To control possible contamination due to the reagents or the sample preparation procedure, blank samples were prepared and analyzed for every sample batch. The total contents of PTEs were determined via ICP-OES (iCAP 6300 Duo S, Thermo Scientific, Antwerpen, Belgium) by axial plasma observation, with the exception of Mn (for which the radial plasma view mode was used).
Analytical methods were validated via analysis of certified reference materials (CRM) using the CRM—Bush Branches and Leaves NCS DC73348, LGC standards. The percentages of recovery ranged from 91 to 99%, depending on each analyzed element. The extraction of trace elements and analyses were performed in the Laboratory of Analytical Chemistry and Computer Chemistry of the University of Plovdiv “Paisii Hilendarski”.
2.3.2. Leaf Traits
Macroscopic leaf diagnostics are one of the most useful indicators to measure the effect of air pollution plants [23]. In order to assess the impact of the urban environment on the growth and development of the selected tree species, some macroscopic observations of the leaf petiole were made following the International Cooperative Program for monitoring the effect of polluted air on the forests, implemented by the National Biomonitoring Program in Bulgaria [24]. Changes in the leaf color (chlorosis and necrosis) were classified into five groups according to the percentage of injuries on the total leaf surface.
2.3.3. Tree Physiology
Physiological measurements were performed on sunny windless mornings from 8:30 to 11:30 from 5 to 10 August each year. Three fully developed leaves exposed to the sun at the height of approximately 2 m were selected from each sapling. During the measurements, the temperature and relative humidity of the leaf chamber were monitored. To track leaf photosynthetic rate, the leaves were induced with saturation light intensity of 1000 μmol quanta/m2/s; the reference CO2 concentration was also monitored [12]. The data acquisition time for each measurement was 3 min. Portable photosynthetic system Q-box CO650—Plant CO2 Analysis Package (Qubit Systems Inc., Canada) equipped with a leaf chamber was used. The intensity of photosynthesis (A, μmol m−2 s−1), stomatal conductance (Gs, μmol m−2 s−1), and intensity of transpiration (E, μmol m−2 s−1) were monitored, and the results are presented as arithmetic mean ± SD.
2.3.4. Molecular Markers
In this analysis, some molecular markers were selected to show changes in genetic diversity after plants’ exposure to the urban environment in order to better understand their adaptive mechanisms. To perform the molecular analysis and genotyping of the studied tree species, different molecular marker systems were selected based on the most highly variable regions in the genome—ISSR (inter simple sequence repeat) and iPBS primers (inter-priming binding sites).
Total genomic DNA was isolated from fresh leaves following the STAB protocol [25,26] and the addition of RNAse. The concentration of genomic DNA extracted by the STAB method was checked using gel electrophoresis [27]. PCR analysis was performed using 30–50 ng of the isolated DNA from the leaf samples as a matrix. The PCR reaction contained a total volume of 20 μL 1× PCR buffer (20 mM Tris-HCl pH 8.4, 1.5 mM MgCl2), 200 mM dNTPs, primers (1 μL of 10 μM for (ISSR) and 1 μL of 30 μM for (iPBS)), and 0.25 μL of 5 U/μL Red-Taq DNA polymerase (Canvax, Cordoba, Spain). PCR analysis with primer ISSR—UBC 807 ((AG) 8T) was performed according to the following procedure: initial denaturation at 95 °C for 5 min, 35 cycles of denaturation at 95 °C for 30 s, primer annealing at 48 °C for 45 s, extension at 72 °C for 1 min, and a final extension at 72 °C for 3 min [28]. PCR analysis with two iPBS primers (2087 and 2394) was performed as follows: initial denaturation at 95 °C for 5 min, 35 cycles of denaturation at 95 °C for 30 s, primer annealing at 49 °C for 1 min, extension at 72 °C for 45 s, and a final extension at 72 °C for 3 min [29]. All the amplifications were performed on thermal cycler (Techne, Cole-Parmer, Cambridge, UK). The amplification products were separated by electrophoresis in 1% agarose gel (Merck KGaA, Darmstadt, Germany) using TBE buffer (89 mM Tris-HCl, 89 mM boric acid, 10 mM EDTA, pH 8.0) with added Safe View (NBS Biologicals, Huntingdon, UK) at 100 V for 1 h. PCR products were visualized in 2% (w/v) agarose gel stained with Safe View (NBS Biologicals, Huntingdon, UK) at 100 V for 50 min using a VWR Mini Electrophoresis System (VWR, Vienna, Austria) and MiniBis Pro (DNR Bio-Imaging Systems, Neve Yamin, Israel) for gel visualization. Gene Ruler 1 kb plus (Bioneer, Daejeon, Republic of Korea) was used as a molecular marker. The results of RAPD-PCR profiles were combined and analyzed to obtain a unique dendrogram. A comparison of the profiles obtained was evaluated by calculating an index of genetic similarity using the coefficient of similarity, calculated from Simple Matching by software (VWR, Leuven, Belgium). Cluster analysis was performed using the UPGMA method.
2.4. Data Processing
All data presented are an average of triplicate analysis of three separate subsamples. For the statistical evaluation of the data obtained, the raw values of the three subsamples per species per site are used, and the differences are considered significant when p < 0.05. The Shapiro–Wilk test was used to test the normality of the data as a more appropriate method for small sample sizes (<50 samples). ANOVA and Student/Fisher test were used for testing the differences in studied parameters, both between the three plant species in one plot and also between the four studied sampling plots (p < 0.05). Principal component analysis was applied to evaluate the relationship between plant traits and urbanization intensity. All statistical analyses were made with the STATISTICA version 7 (data analysis software system) [30]. The obtained molecular profiles were evaluated using the genetic similarity index by Statistica 7.0. The cluster analysis was performed using the unweighted pair group method with the arithmetic average calculated (UPGMA).
3. Results
3.1. Concentrations of PTEs in Tree Leaves/Needles
The initial concentrations of eight studied PTEs in the leaves/needles of linden, ash, and black pine at the beginning of the experiment (prior to planting into the urban environment, April 2015) are presented in Table 2. The descending row of the chemical elements for both three plant species was found to be Mn > Zn > Cu > Pb > Cr > V > As > Cd. Four months later (August 2015), due to the urban influence, the content of PTEs significantly increased (p < 0.05) in almost all leaf samples, with some exceptions for Zn, Cu, and V (Table 3). Some changes were observed in the descending row of PTEs in two experimental plots (Plot 1 and Plot 3), where it was found to be Mn > Zn > Pb > Cu > As > Cr > V > Cd—the lead comes before Cu and the As comes before Cr and V.
When regarding the long-term exposure of trees to the urban environment (Table 4), it is obvious that, although a species specificity was demonstrated in the PTE bioaccumulation, there is a stronger anthropogenic pressure on Plot 1 and Plot 3 when comparing to Plot 2, and especially to Plot 4 (p < 0.05). These differences are confirmed by rearranging the descending row of PTE content in plant leaves according to the location of the experimental plot as follows:
- Plot 1—Mn > Zn > Cu > Pb > Cr > As > V > Cd
- Plot 2—Mn > Zn > Cu > Pb > As > Cr > V > Cd
- Plot 3—Mn > Zn > Cu > Pb > V > As > Cr > Cd
- Plot 4—Mn > Zn > Cu > Pb > Cr > V > As > Cd.

Table 4.
Concentrations of some potentially toxic elements (PTEs) in tree leaves/needles (in mg/kg) in August 2020—6 years after transplantation into the urban environment.
Table 4.
Concentrations of some potentially toxic elements (PTEs) in tree leaves/needles (in mg/kg) in August 2020—6 years after transplantation into the urban environment.
| Plant Species | Plant Location | As mg/kg | Cd mg/kg | Cr mg/kg | Cu mg/kg | Mn mg/kg | Pb mg/kg | V mg/kg | Zn mg/kg |
|---|---|---|---|---|---|---|---|---|---|
| T. tomentosa | Plot 1 | 0.16 | 0.047 | 0.76 | 6.4 | 43 | 2.6 | 0.34 | 20 |
| Plot 2 | 0.27 | 0.043 | 0.35 | 15.0 | 28 | 6.5 | 0.35 | 19 | |
| Plot 3 | 0.30 | 0.058 | 0.36 | 6.0 | 61 | 2.7 | 0.47 | 23 | |
| Plot 4 | 0.15 | 0.041 | 0.33 | 5.1 | 28 | 2.6 | 0.30 | 17 | |
| F. excelsior | Plot 1 | 0.48 | 0.020 | 0.55 | 5.2 | 19 | 1.6 | 0.33 | 21 |
| Plot 2 | 0.40 | 0.210 | 0.35 | 9.3 | 40 | 2.0 | 0.24 | 22 | |
| Plot 3 | 0.15 | 0.022 | 0.25 | 25.0 | 25 | 1.9 | 0.33 | 16 | |
| Plot 4 | 0.09 | 0.018 | 0.22 | 4.0 | 17 | 1.1 | 0.22 | 15 | |
| P. nigra | Plot 1 | 0.25 | 0.049 | 0.74 | 5.2 | 28 | 4.2 | 0.16 | 23 |
| Plot 2 | 0.43 | 0.028 | 0.38 | 3.3 | 28 | 2.3 | 0.28 | 23 | |
| Plot 3 | 0.39 | 0.034 | 0.23 | 4.1 | 46 | 1.3 | 0.42 | 36 | |
| Plot 4 | 0.05 | 0.027 | 0.10 | 2.9 | 17 | 1.1 | 0.14 | 22 |
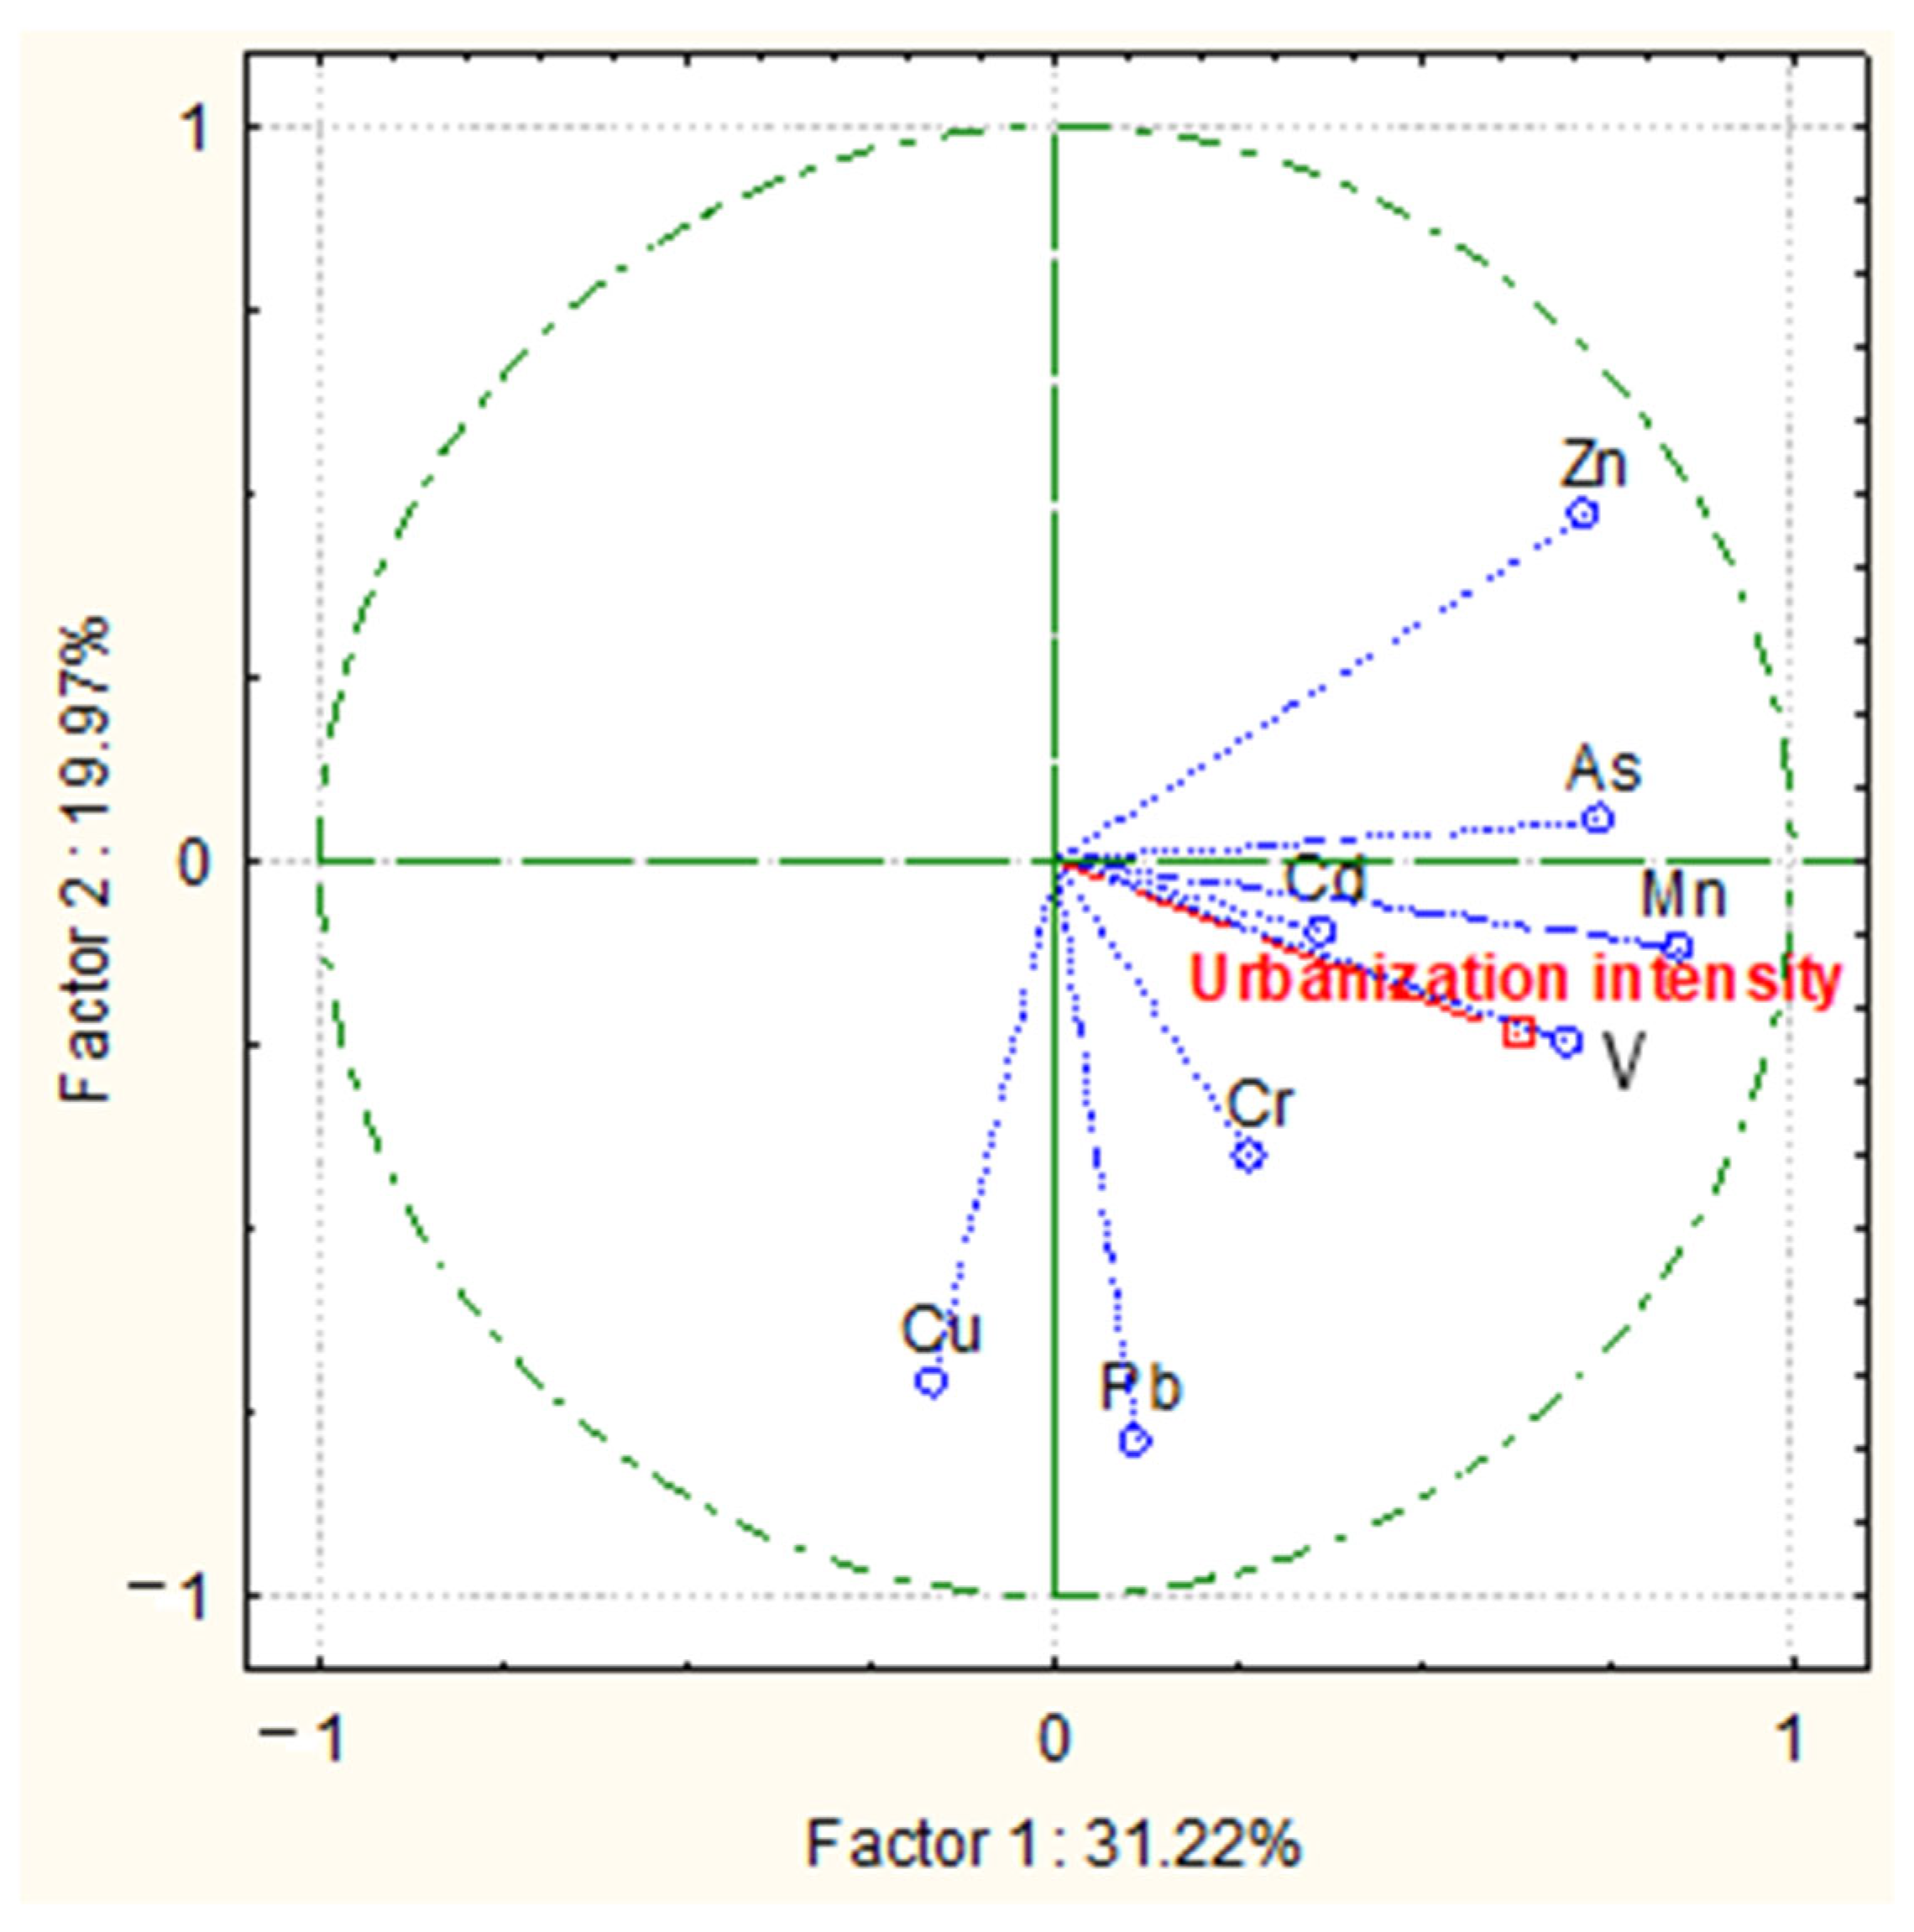
A general trend was observed correlating a higher content of PTEs in leaf samples with higher urbanization intensity (Figure 2). The score and bi-plot graph resulted from the principal component analysis (PCA) to evaluate the relationship between PTEs content in leaves of the three species grown at the four different locations in Plovdiv and urbanization intensity. This demonstrated that the first two components, i.e., Factor 1 and Factor 2, accounted for 51% of the total variance in the dataset. Two of the studied elements, Zn and Cu, were more strongly displaced from the others, giving a clear indication that their content is not so greatly related to the external factors in the urban environment. In fact, both these elements, at the optimal range, are essential for plant growth and performance [24], contrary to the other six elements.
3.2. Leaf Traits
In this study, visible leaf injury symptoms, including necrosis (dead leaf tissue occurring in brown spots) and chlorosis (leaf tissue with a decreased chlorophyll content, observable as yellow patches on the leaf), were considered [23]. Leaves/needles of the studied plant species could be classified as low and medium damaged as the observed injuries were up to 45% of the leaf petiole (Table 5). T. tomentosa was found to be the most heavily affected (up to 45% of leaf surface) (Figure 3b), followed by P. nigra (up to 30%) (Figure 3c). F. excelsior could be pointed to as least susceptible to urban impact as the leaf injuries were found only on individuals growing at Plot 3 (up to 15%), which probably could be related to the specific anatomy of ash leaves. The earlier appearance and stronger exhibition of chlorosis and necrosis were observed on the leaf samples from Plot 3 (very high urbanization intensity) as well as on samples from Plot 1 (high urbanization intensity). These findings correspond with the results of other studies [23,31], i.e., leaf injury properties of Tilia sp. can be linked to urban habitat quality, and in the most polluted urban habitat, leaf injury reached the highest values.
3.3. Physiological Traits
Plant photosynthesis is a complex physiological process and, in general, mainly consists of three steps: (1) primary reactions, including light absorption, transmission, and conversion; (2) electron transport, photophosphorylation, and the formation of biological chemical energy (ATP and NADPH); and (3) carbon assimilation, which is the conversion of active chemical energy into stable chemical energy (fixed CO2, formation of sugars) [32]. The photosynthesis/photosynthetic rate would be inevitably altered if one step is affected. Intensive measurements of the physiological process of photosynthesis could help in understanding the relationships between environmental changes and photosynthesis [12].
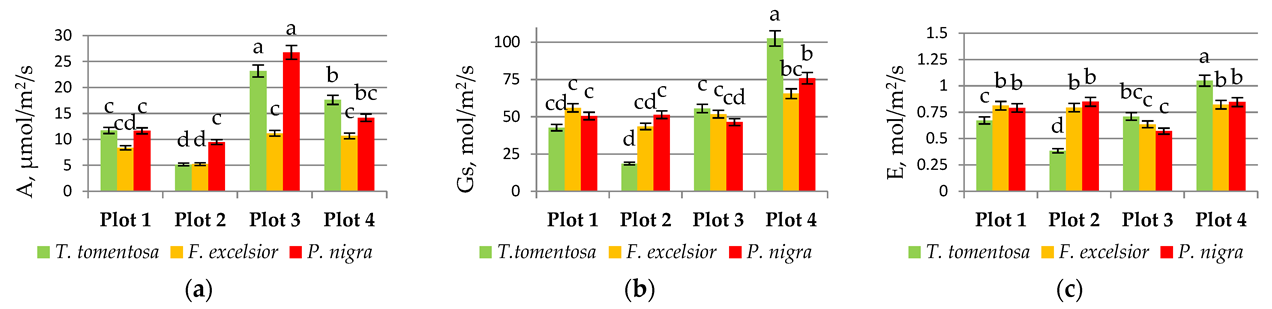
Based on the results obtained, it is obvious that the maximum intensity of the photosynthetic process is detected in Plot 3 (very high urbanization intensity) for all tree saplings (Figure 4a). Similar findings have been published by Takagi and Gyokusen [33], who found that the photosynthetic rate of the urban core was highest and that of the suburban area was lowest. Photosynthesis is regulated by both stomatal and biochemical factors [34]. The decrease in stomatal conductivity is caused by a stressful urban environment (Figure 4b). Impervious pavement decreased the amount of water available for trees, and leaf stomatal conductance was reduced [35].
Apart from the three steps of the photosynthetic process, transpiration (E) is an important process influencing the physiological status of plants. Our results show that the transpiration process was also significantly influenced by the urban environment in the first three plots in comparison with the control one (Figure 4c). Wang et al. [12] also found that photorespiration and other essential processes of ash decreased significantly in areas of both pervious and impervious pavements.
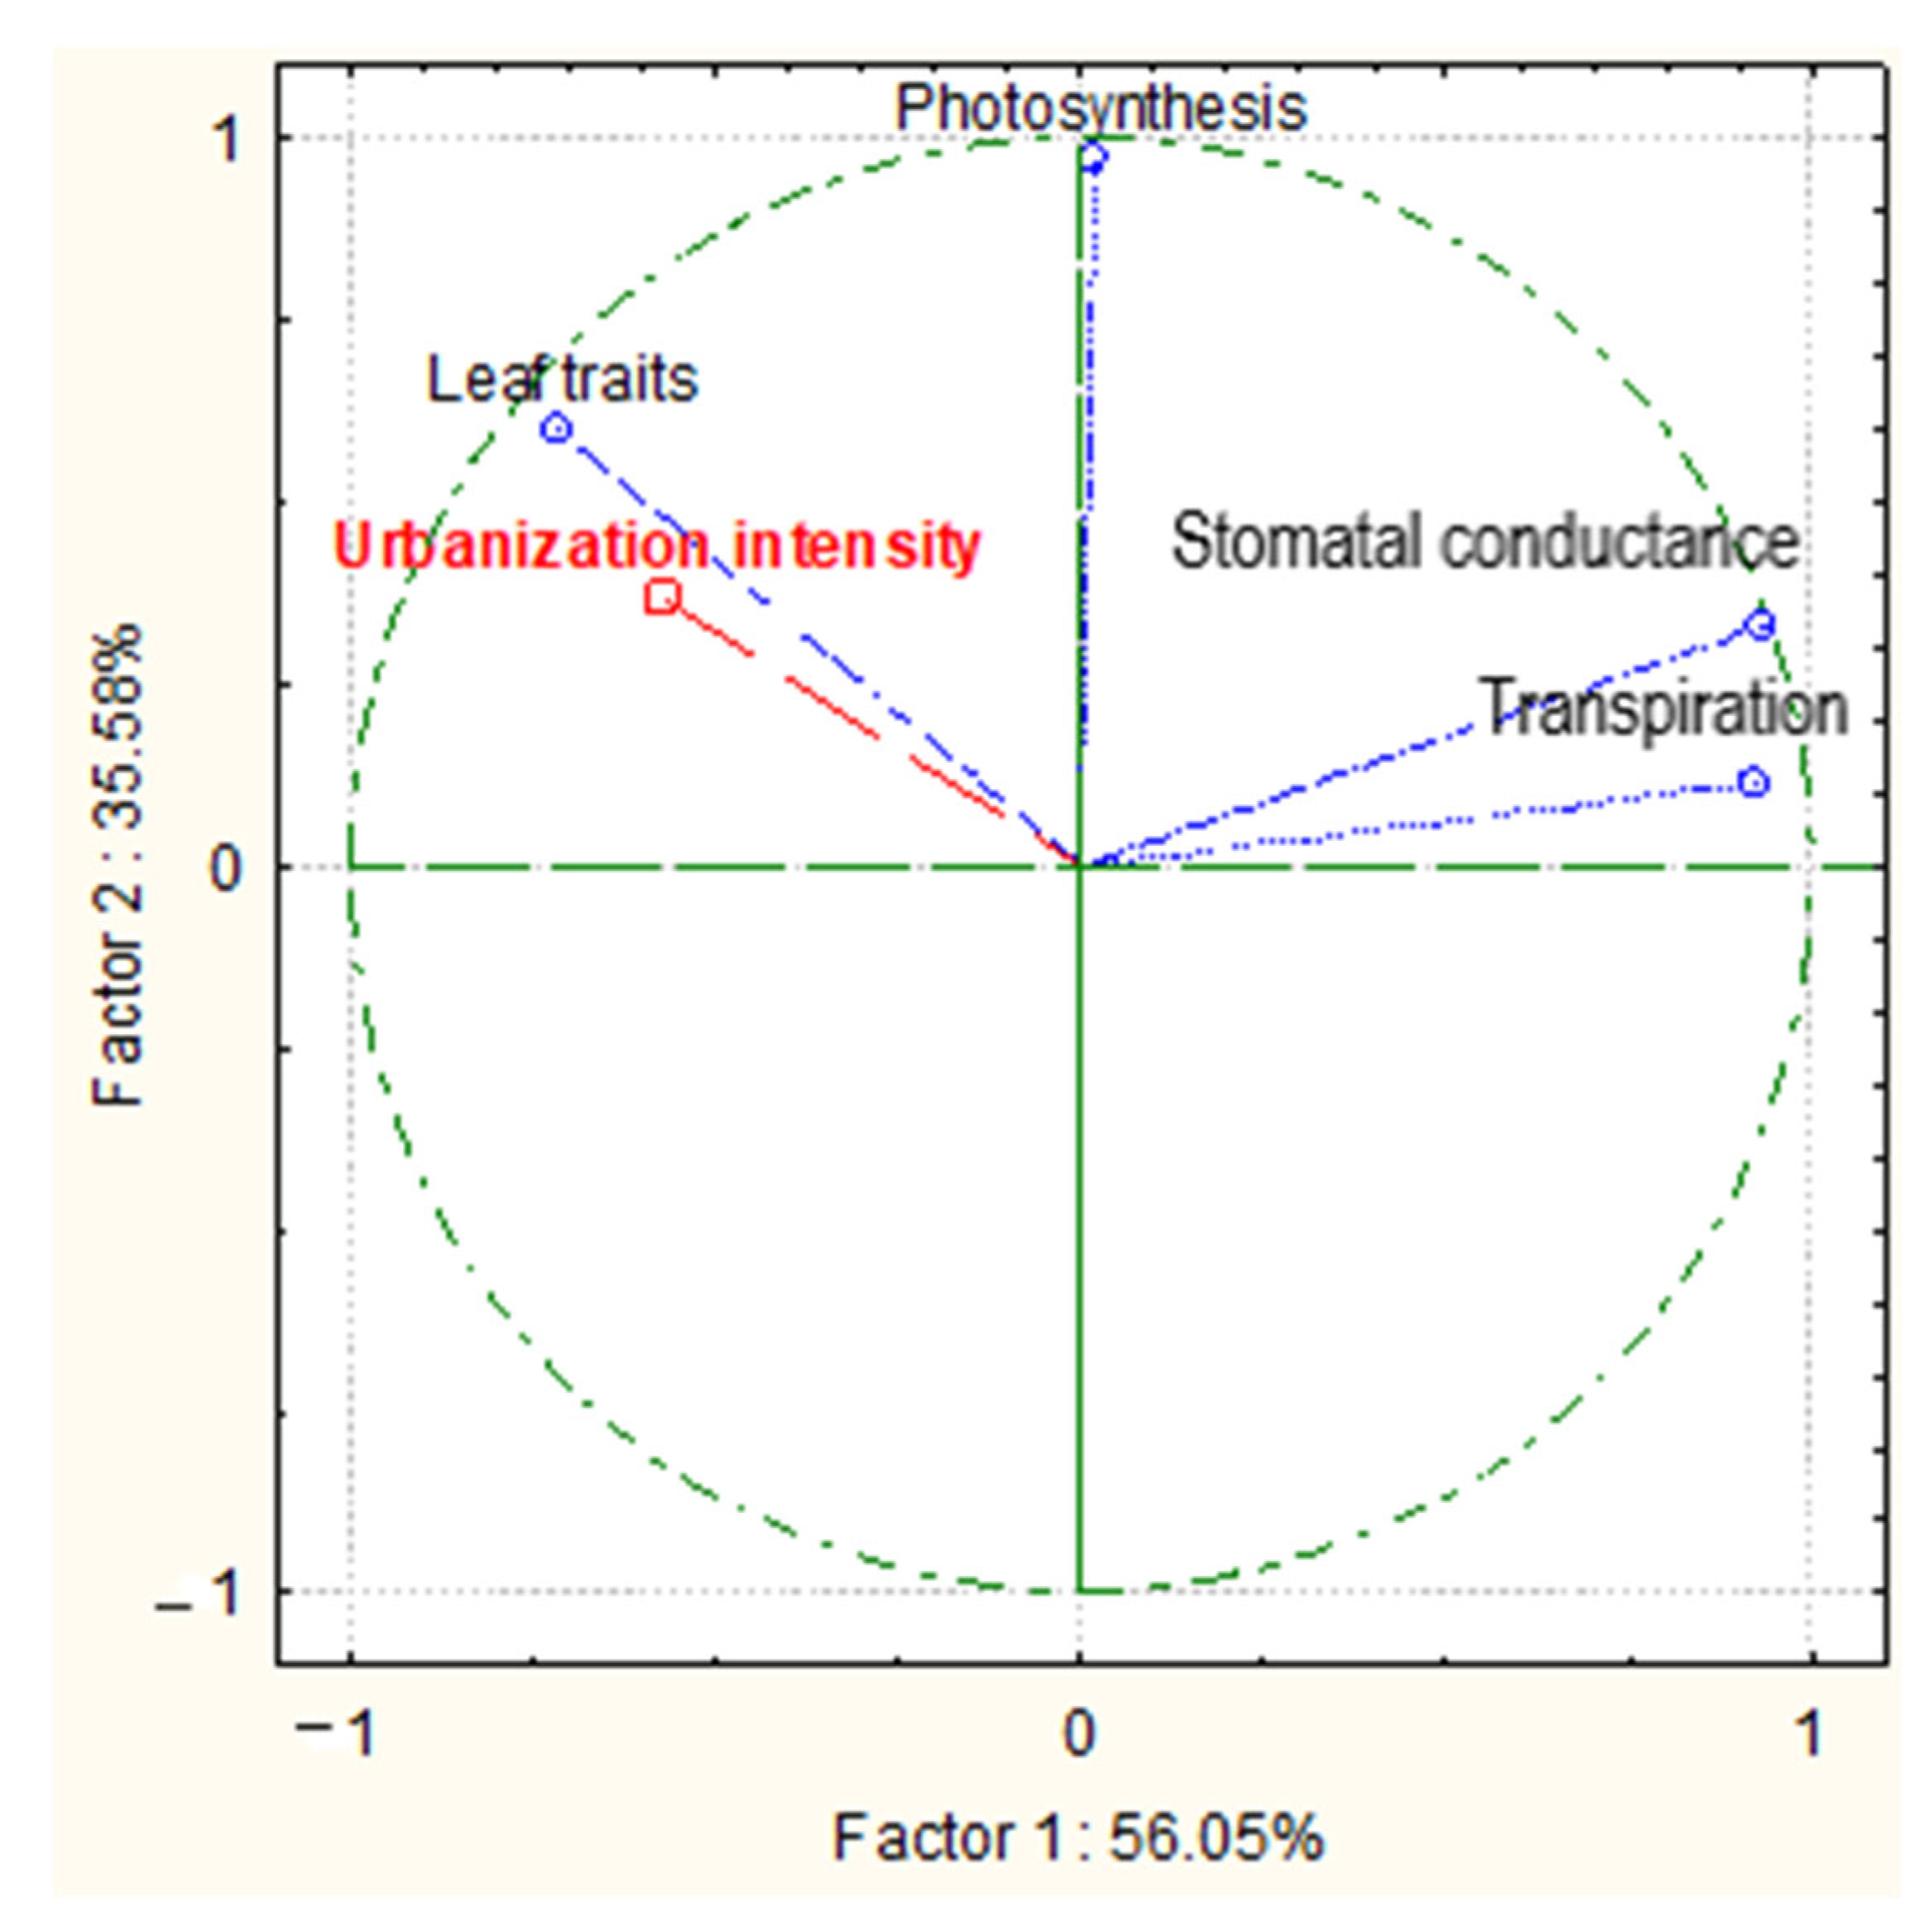
The bi-plot graph (Figure 5) resulted from principal component analysis (PCA) to evaluate the relationship between leaf traits, physiology traits, and urbanization intensity and demonstrated that the first two components, i.e., Factor 1 and Factor 2, accounted for 91% of the total variance in the dataset. A stronger correlation was found between leaf injuries and the intensity of urbanization, as well as between photosynthesis rate and urbanization. The two other physiological traits (stomatal conductance and transpiration) were negatively related to the anthropogenic load (Figure 5). ANOVA analysis revealed the coefficient value of F = 4.32 at p = 0.03 for all studied physiological traits, confirming their strong relationship with the intensity of urbanization.
3.4. Molecular Traits
Molecular analyses of newly planted saplings of T. tomentosa, F. excelsior, and P. nigra were performed once per year in the period from 2015 (the initial year of planting in the urban area) up to 2020 (6 years after planting in the urban environment). First molecular traits in the studied genetic profiles were observed after the 5th year, but they were not very well expressed. Better results were obtained during the next year (2020), and they are presented and discussed here.
3.4.1. ISSR—PCR Analysis
ISSR—PCR analysis of the studied tree species showed significant differences in the obtained genotype profiles of seedlings from Plot 4 (conditional control) and genotypes of seedlings from the other three experimental plots with enhanced anthropogenic impact (p < 0.05). Out of the 55 profiles obtained from the one ISSR primer (UBC 807), 13 bands (23.64%) were polymorphic. When considering the ISSR profiles of the saplings from Plots 1, 2, and 3, some similarities were found too, which probably could be interpreted as adaptive changes. The highest percentage of similarity in the amplified fragments was observed in the saplings of F. excelsior, planted in the first three experimental plots, most strongly expressed in Plot 1. The profiles of the P. nigra saplings from these three plots were similar also, although less pronounced. Here, polymorphism was detected by both the bands from Plot 1 and Plot 2. With regard to T. tomentosa saplings, a weak polymorphism was reported only for the profiles from Plot 1 and Plot 3 (Figure 6a).
The results of two series of ISSR profiles were combined in cluster analysis, and a unique diagram was generated showing the intraspecific and interspecific genetic diversity of the studied tree species as a consequence of the impact of urbanization (Figure 6b). The obtained molecular profiles were evaluated and compared using the genetic similarity index and correlation coefficients (p < 0.05). Genetic profiles of T. tomentosa saplings from Plot 2 and Plot 3 showed higher similarity values, lower similarity was found in the profile of linden from Plot 1, and the profiles from Plot 4 were the least similar (Figure 6b). Although the effects on P. nigra saplings were less pronounced as a whole, the amplified profiles of individuals from Plot 4 showed the lowest similarity value in comparison with the saplings from the other three plots. Similar findings have been observed between the F. excelsior saplings too, where the significant polymorphic profile amplification was detected in Plots 1, 2, and 3. The highest similarity was proven to exist between saplings from Plot 1 and Plot 2, followed by those from Plot 3 (p < 0.05) (Figure 6b).
3.4.2. iPBS—PCR Analysis
Based on the results obtained, it is obvious that the selected iPBS primers are effective when studying the genetic diversity in T. tomentosa, P. nigra, and F. excelsior. Four selected iPBS primers resulted in the amplification of a sufficient number of clearly distinguishable and reproducible fragments with lengths from 200 bp to 2000 bp (Table 6).
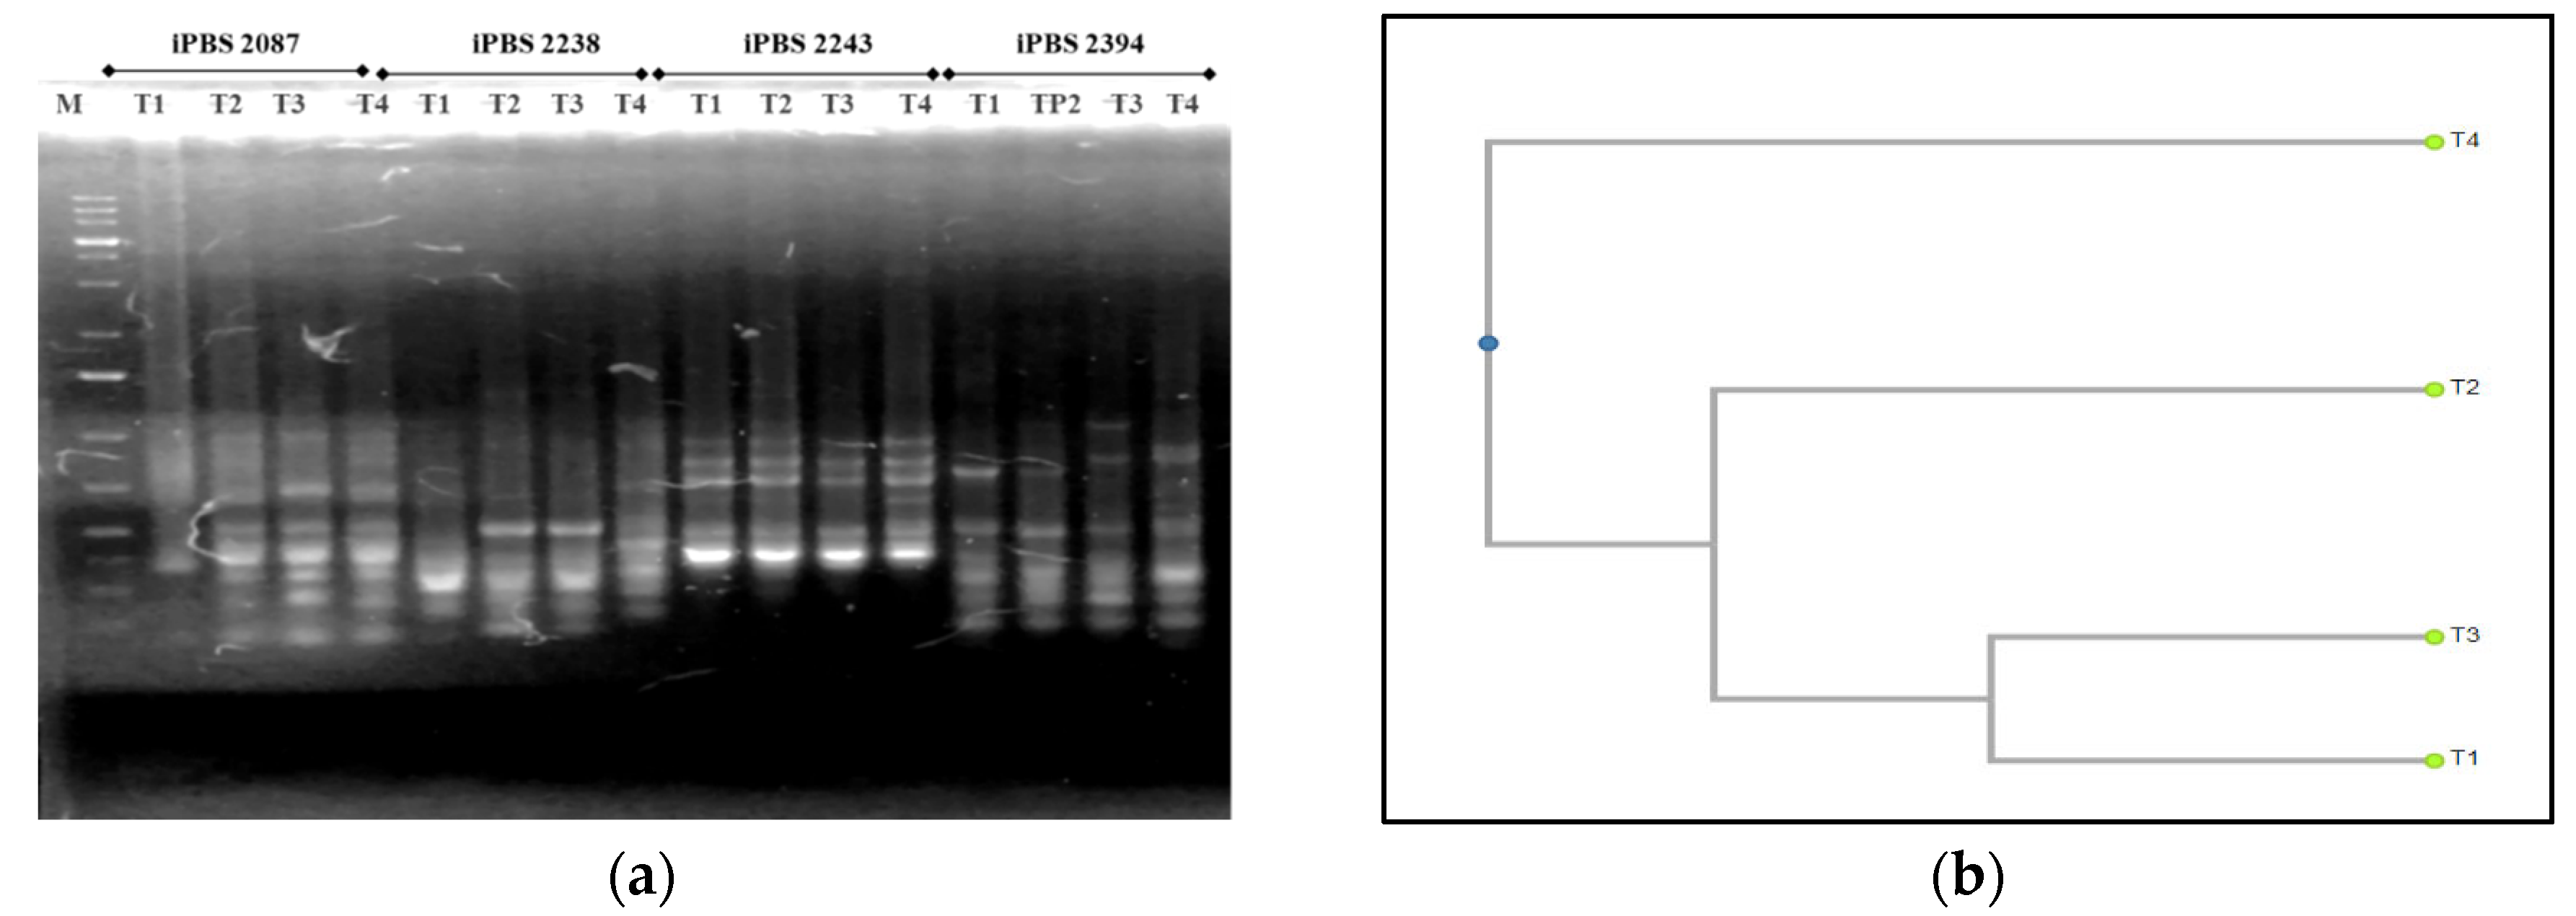
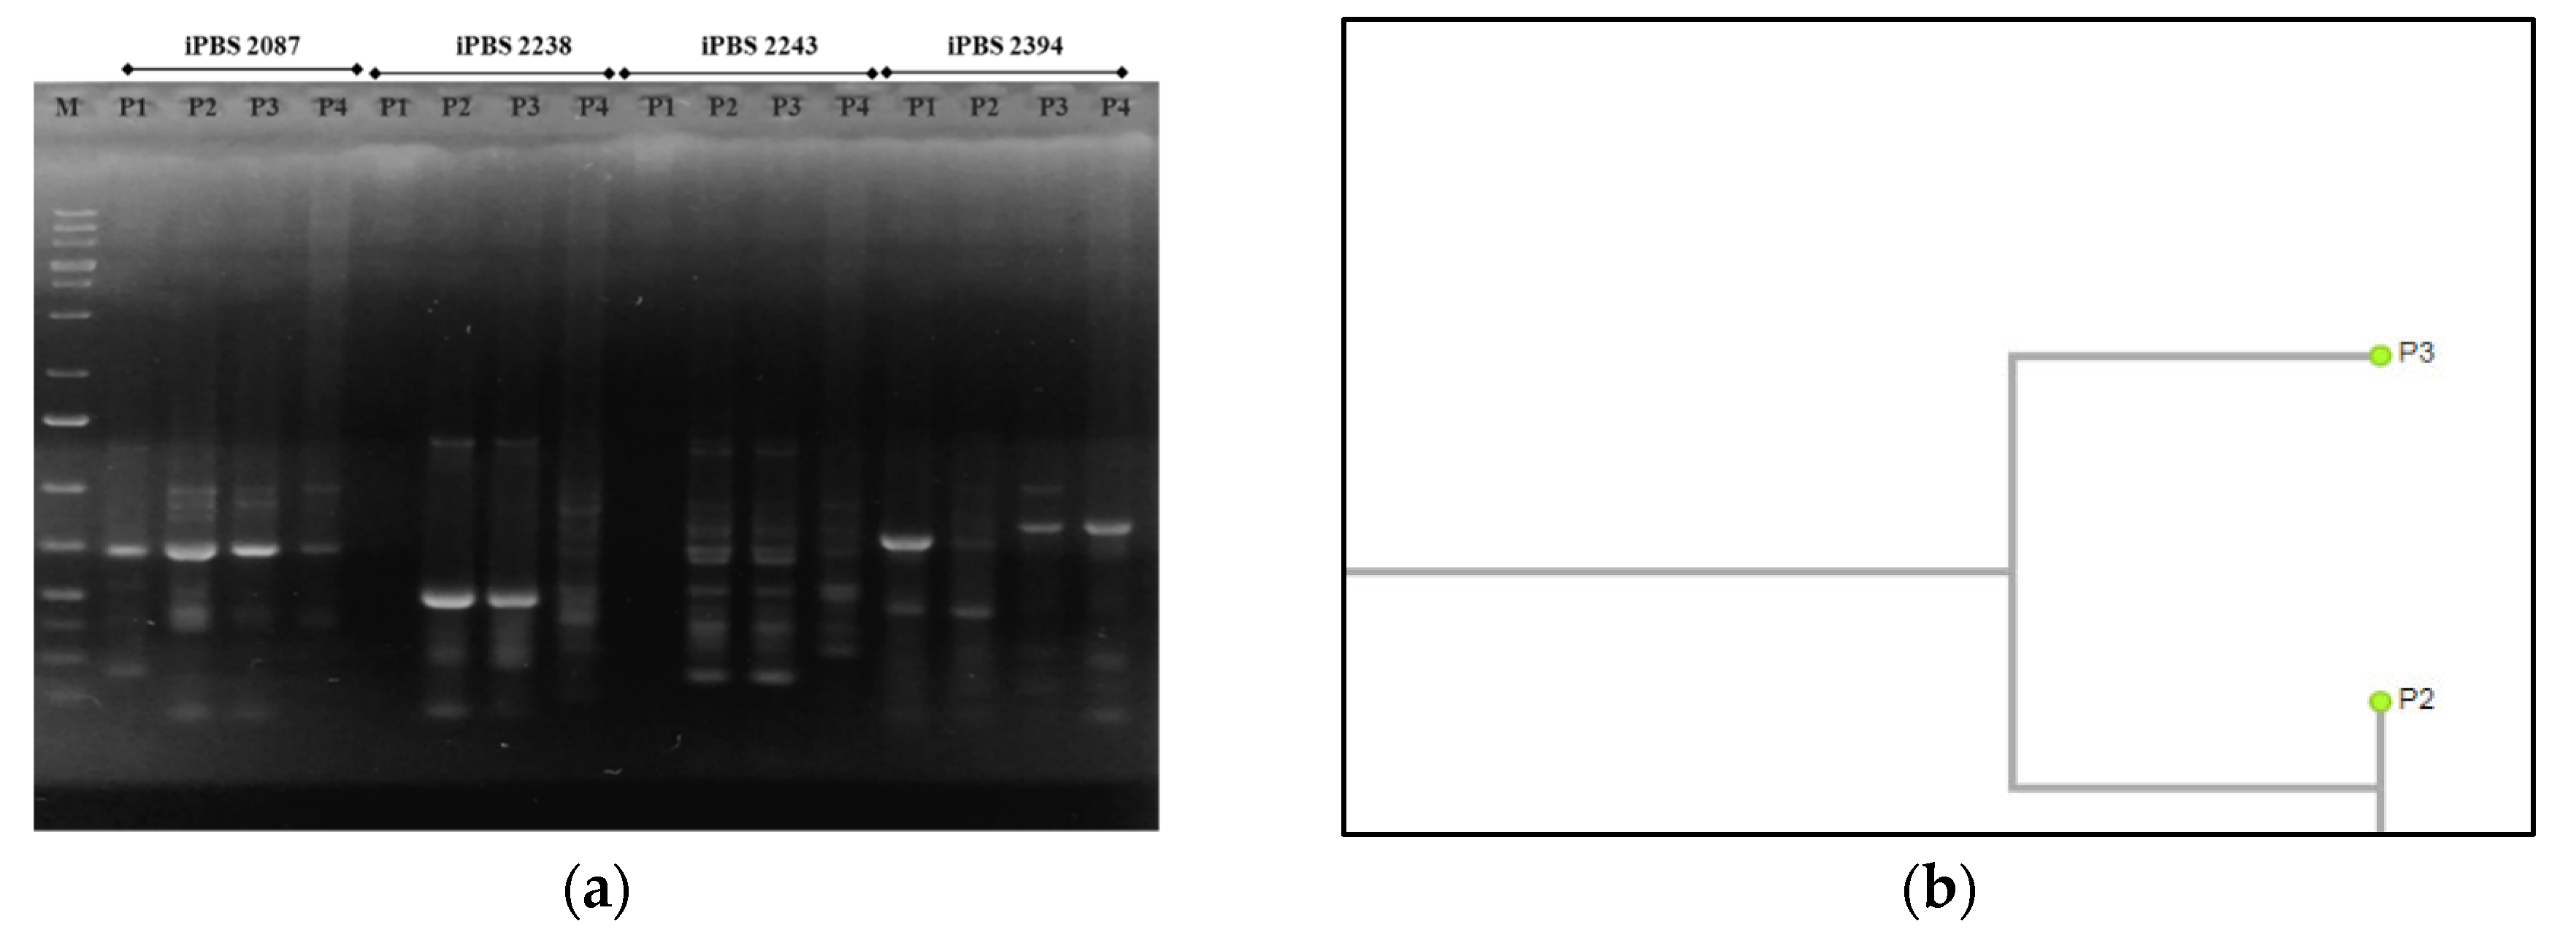
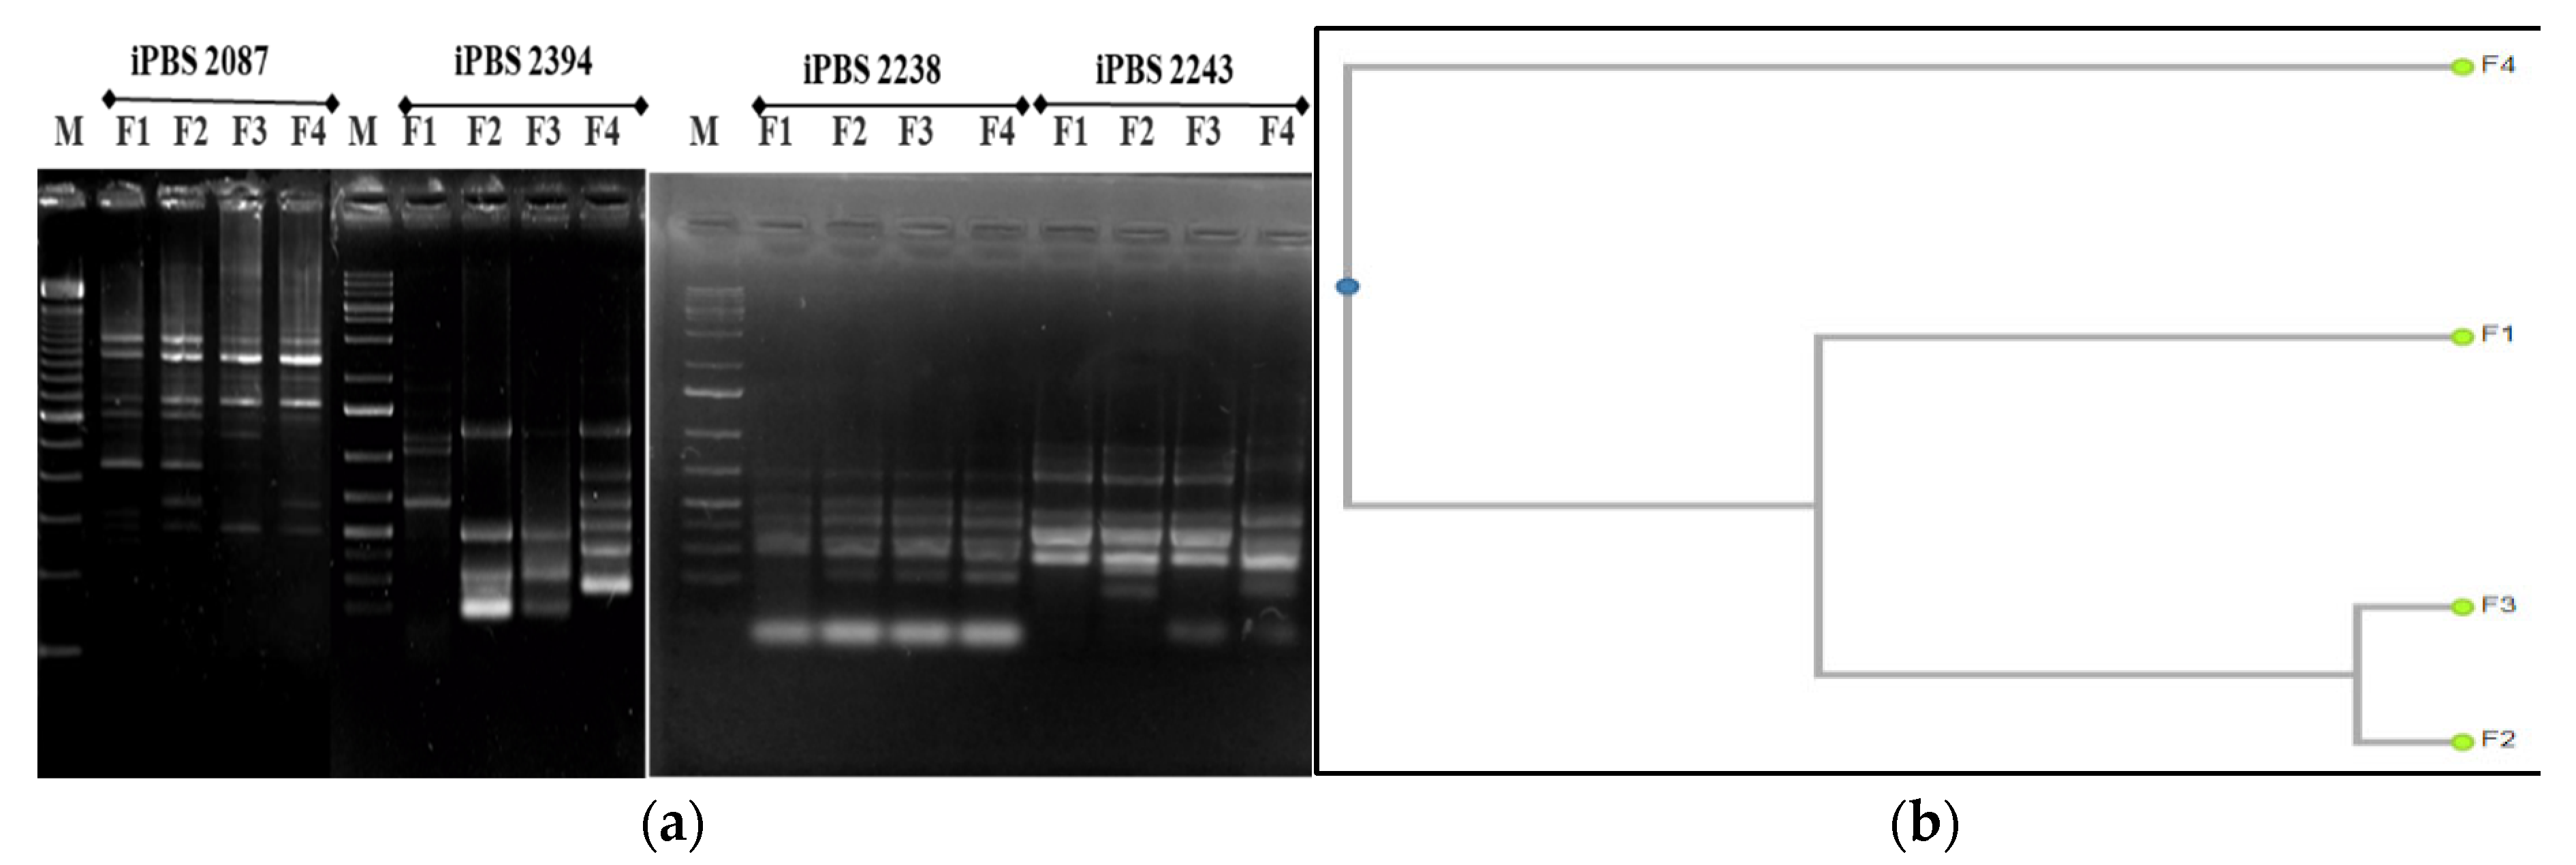
The largest number of fragments were amplified in T. tomentosa, but the level of polymorphic bands was the lowest. Furthermore, the profiles with both iPBS primers (2394 and 2087) were almost identical. The microsatellite sequence-based primer (2394) proved more informative than the retrotransposon-based primer (2087) (p < 0.05). When considering the differences in the genetic variation of the DNA profiles from the three more influenced plots, the first primer was more appropriate in Plot 3, and the second primer in Plot 1 (Figure 7a). The phylogenetic tree revealed that iPBS 2087 results in the amplification of the 5-monomorphic and 1-polymorphic fragments. A total of two profiles exist, with only the profile amplified at T1 being polymorphic and the other three profiles amplified at T2, T3, and T4 being monomorphic. There are two clearly defined clusters, T2 and T4, which are at a great distance from T1 and T3, which cluster together. This result matches the microsatellite marker data in Figure 7b. The profiles of the P. nigra experimental trees, amplified with the iPBS marker system, were also much more pronounced than the retrotransposon-based one (p < 0.05). Significant differences were proved in data from Plot 4 when compared to the other three plots with both primers used (Figure 8). The iPBS primer (2394) showed a more pronounced polymorphism in the amplified fragments of Plot 3, and the iPBS primer (2087) showed the same in the fragments of Plot 1. Results in Figure 9 show that most of the polymorphic profiles were amplified by the iPBS marker system with F. excelsior DNA saplings, and the most intensive fragments were detected using the iPBS primer (2087). This primer revealed 13 identical profiles and two polymorphic bands in the three more influenced urban plots than the remaining plot (2394), where significant differences were found only in Plot 1. Similar to that of linden, the profiles with both iPBS primers in the control Plot 4 were almost identical (Figure 9a).
One of the unique properties of the plant organism is its ability to self-regulate, adapt, and self-adjust to achieve maximum productivity. The adaptive capabilities of plants to changing environmental factors contribute to the preservation of the species. The process of adaptation of the plant to the specific ecological conditions of the environment is very complex, multi-stage, and at the same time unified. As a result of plant–environment interaction, a dynamic equilibrium is established, through which an optimal mode is realized for the course of all physiological processes at the level of cells, tissues, and organs, and at the level of the whole organism [36]. The overall organism is characterized by synchronization and coordination in the metabolic processes of individual organs. As a result of an extreme impact, an adaptive reaction usually takes place, expressed in a kind of competition for nutrients and physiologically active substances between individual organs. As a result, attractive points arise in which the necessary minimum of plastic substances for the formation of the reproductive organs is located. In the leaves, there is a redirection of assimilates from the old to the young leaves, as a result of which the old leaves die [37]. At the population level, within a phytocenosis, as a result of stressful effects, another mechanism is included—selection, as a reaction for the survival of the most resistant and adaptable plants. In this case, under specific stress conditions, new varieties and phenotypes may arise (genetic adaptation) [36].
In the present study, a total of five primers, one ISSR-807 primer and four iPBS primers, were used for molecular analysis purposes. Among these selected primers, ISSR-807 and iPBS-2087 successfully amplified nucleotide sequences in the genome of tree variants grown under different influences of anthropogenic factors in an urban setting. Table 6 summarizes the data from the molecular analyses with the primers used. The total number of products is 31, of which a total of 7 bands are polymorphic, and 24 are monomorphic bands. The polymorphism rate was calculated to be 22.58%. Both molecular marker systems are successfully evaluated as highly informative for genetic diversity in the studied plant species at the interspecific as well as the intraspecific levels (p < 0.05).
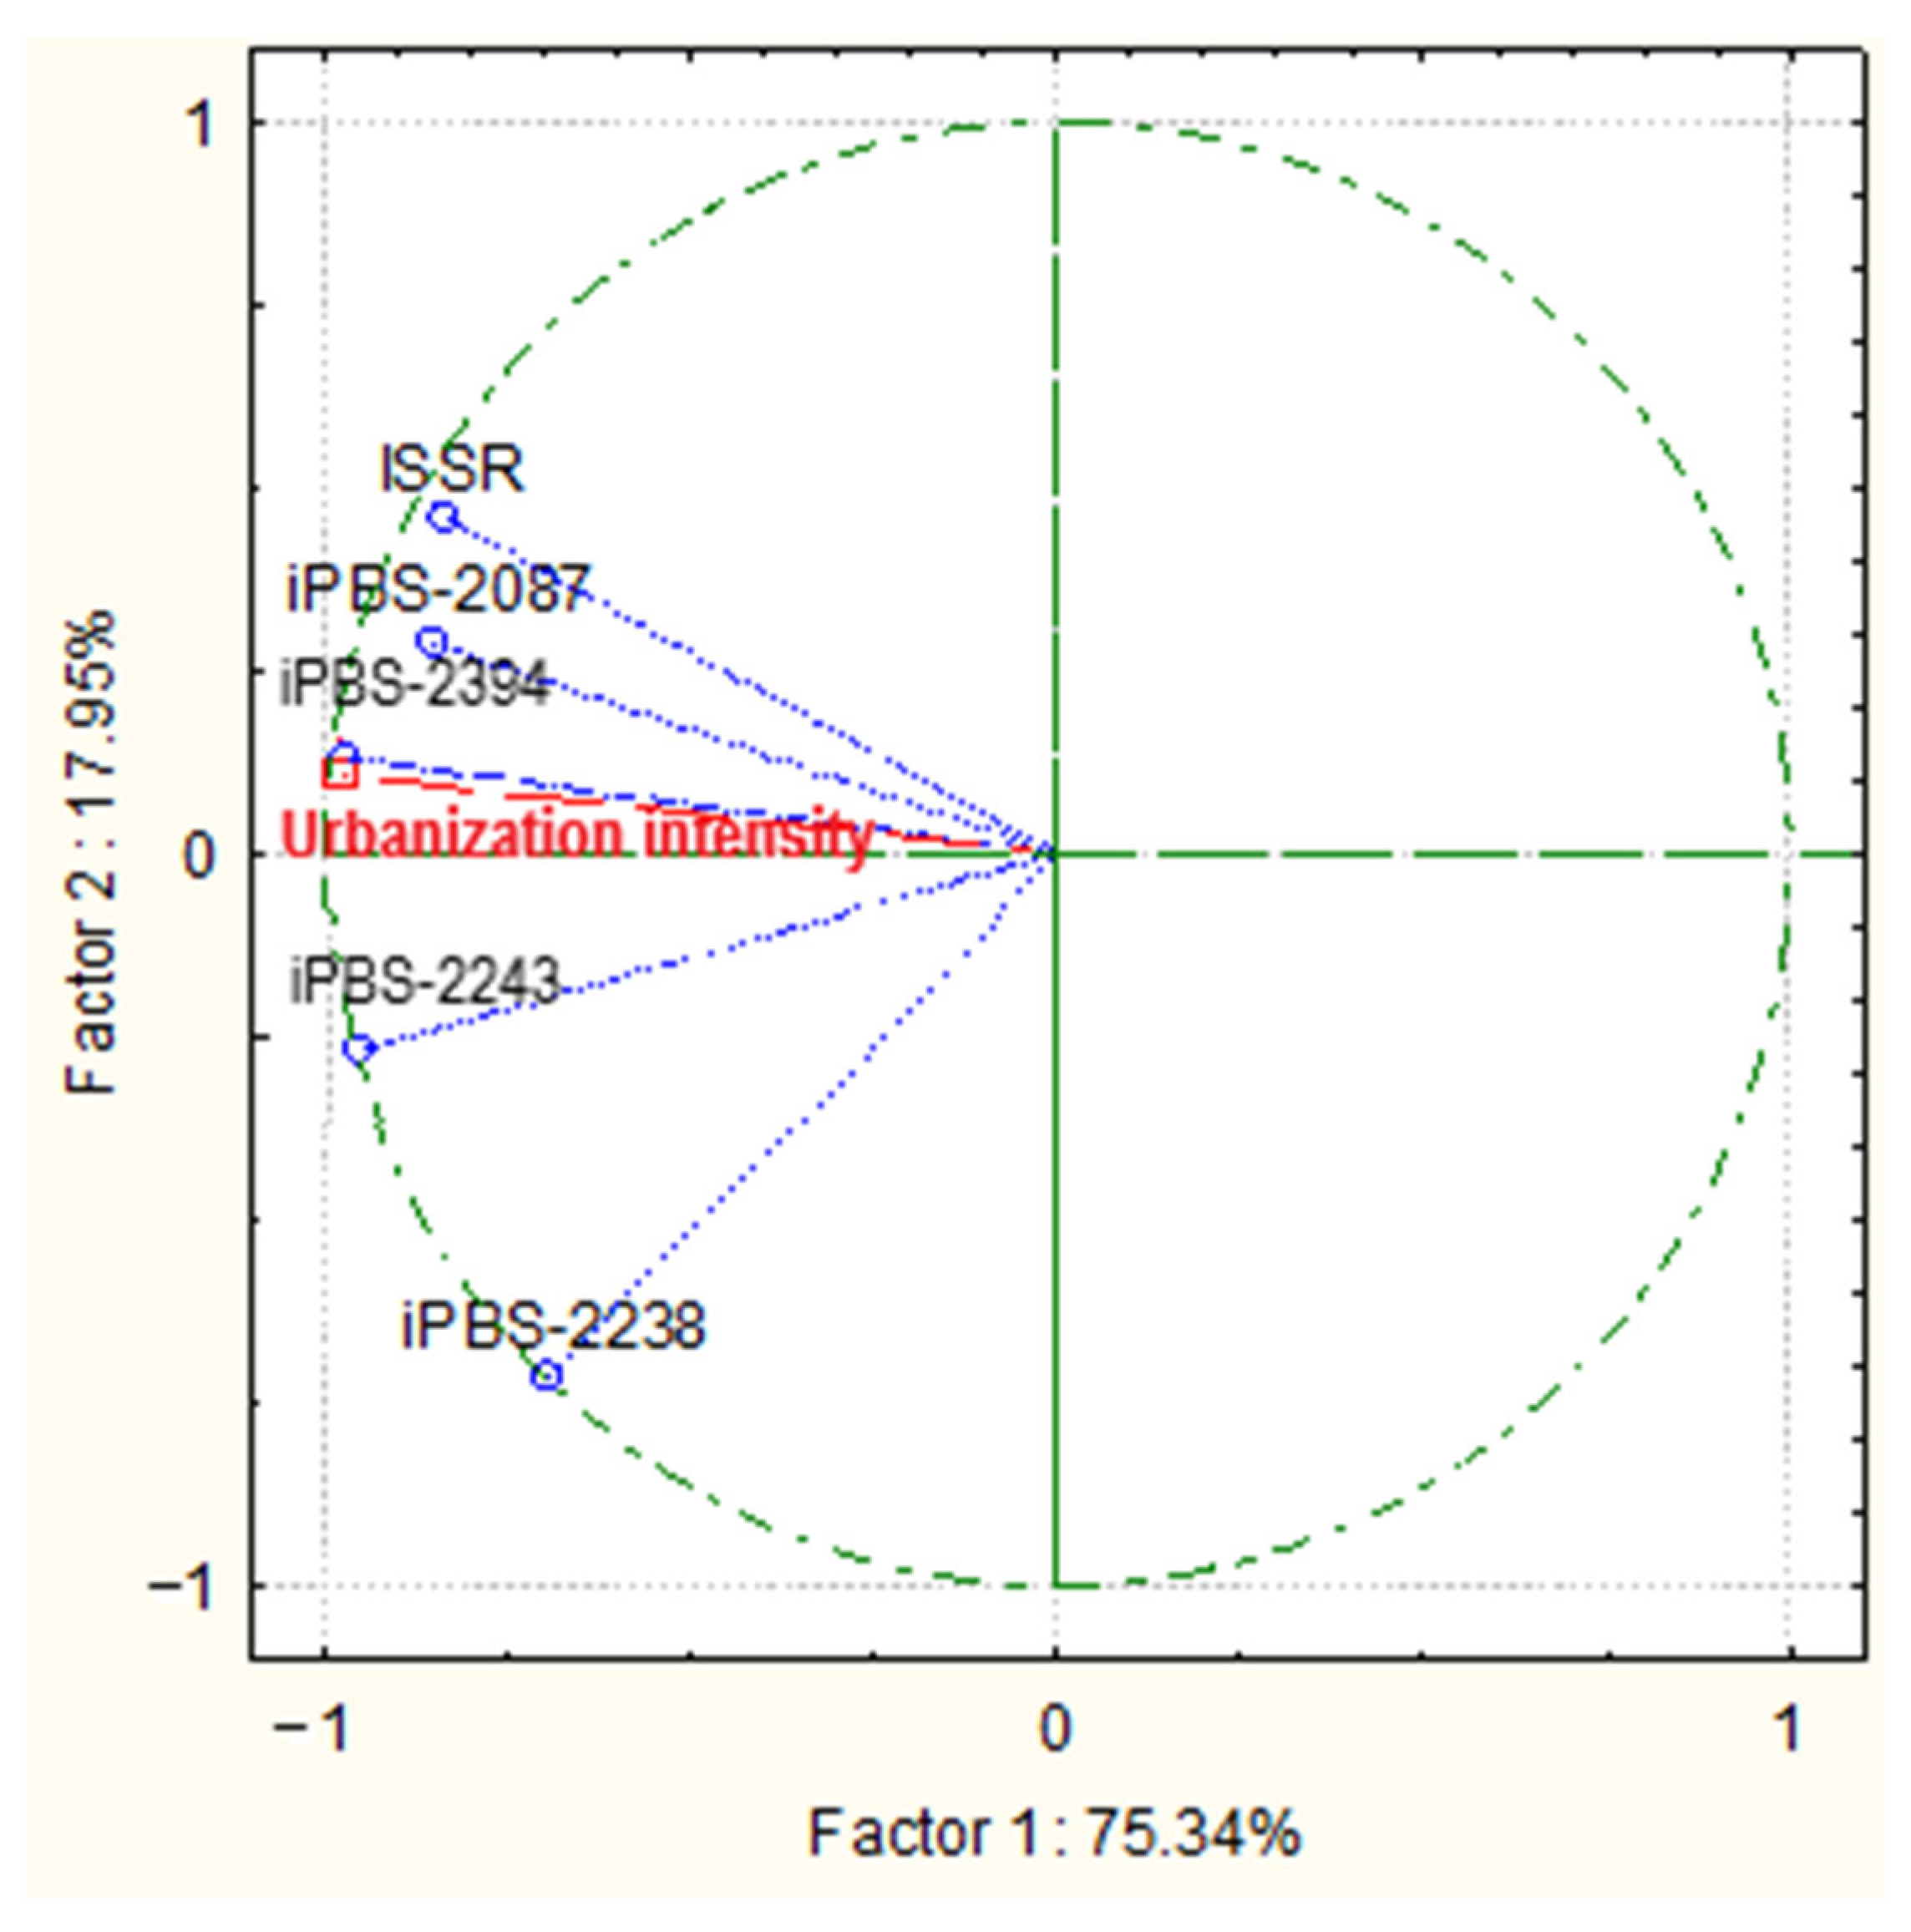
The bi-plot graph that resulted from the principal component analysis (PCA) to evaluate the relationship between different molecular traits and the urbanization intensity showed that the first two components, i.e., Factor 1 and Factor 2, accounted for 89% of the total variance in the dataset. The intensity of urbanization correlated with all of the molecular markers used, being less pronounced with iPBS-2238 (Figure 10). ANOVA analysis resulted in the coefficient value of F = 37.241 at p = 0.001 for all studied molecular markers in combination, while in separate analyses, a significant relationship was found only for ISSR and iPBS-2238, where the coefficient values were F = 3.010 at p = 0.024 and F = 2.964 at p = 0.057, respectively.
4. Conclusions
The processes of plant adaptations to the environment and their pathways are still not fully understood, resulting in the need to screen for novel biomarkers and continued research. We illustrated that the growth of urbanization intensity increased the concentrations of potentially toxic elements in tree leaves, caused leaf injuries, and enhanced the maximum photosynthetic rate but decreased the transpiration rate and stomatal conductance. At the molecular level, the percentage of polymorphic bands was found to also depend on urbanization intensity. High similarity was observed between the trees in the first three experimental plots, with the lowest similarity in the control plot, confirmed by UPGMA analysis. This fact is in agreement with some previous findings that ecological factors in urban areas provoke different defensive and adaptive responses in plants, which could act on different organization levels and could involve different mechanisms.
In conclusion, it can be said that plants have a whole complex of mechanisms by which they carry out a variety of adaptive reactions at different levels as a response to the extreme impacts of urbanization. Identifying the plant diversity pattern across urbanization gradients and the correlation between built-up areas with plant diversity, plant nativity, plant traits, and environmental factors are very important for urban planners towards new green infrastructure and how to preserve plant diversity in urban areas.
Author Contributions
Conceptualization, S.P. and M.P.; methodology, S.P. and M.P.; software, M.P.; validation, S.P. and M.P.; writing—original draft preparation, S.P. and M.P.; writing—review and editing, S.P.; visualization, S.P.; project administration, S.P.; funding acquisition, S.P. All authors have read and agreed to the published version of the manuscript.
Funding
This research was funded by Plovdiv University “Paisii Hilendarski”-NPD, grant number MU21-BF010.
Data Availability Statement
The data presented in this study are available on request from the corresponding author.
Acknowledgments
We are really grateful to Michael Sandy (University of Dayton, USA) for improving the English language of the manuscript.
Conflicts of Interest
The authors declare no conflict of interest.
References
- Brune, M. Urban Trees under Climate Change. Potential Impacts of Dry Spells and Heat Waves in Three German Regions in the 2050s; Report No. 24; Climate Service Center Germany: Hamburg, Germany, 2016. [Google Scholar]
- Locosselli, G.M.; de Camargo, E.P.; Moreira, T.C.L.; Todesco, E.; Andrade, M.F.; de André, C.D.S.; de André, P.A.; Singer, J.M.; Ferreira, L.S.; Saldiva, P.H.N.; et al. The role of air pollution and climate on the growth of urban trees. Sci. Total Environ. 2019, 666, 652–661. [Google Scholar] [CrossRef] [PubMed]
- Pretzsch, H.; Biber, P.; Uhl, E.; Dahlhausen, J.; Schütze, G.; Perkins, D.; Rötzer, T.; Caldentey, J.; Koike, T.; Con, T.V.; et al. Climate change accelerates growth of urban trees in metropolises worldwide. Sci. Rep. 2017, 7, 15403. [Google Scholar] [CrossRef] [PubMed] [Green Version]
- Martínez-López, S.; Martínez-Sánchez, M.J.; Pérez-Sirvent, C.; Bech, J.; Martínez, M.d.C.G.; García-Fernandez, A.J. Screening of wild plants for use in the phytoremediation of mining-influenced soils containing arsenic in semiarid environments. J. Soils Sediments 2014, 14, 794–809. [Google Scholar] [CrossRef]
- Ilyas, M.; Liu, Y.Y.; Shah, S.; Ali, A.; Khan, A.H.; Zaman, F.; Yucui, Z.; Saud, S.; Adnan, M.; Ahmed, N.; et al. Adaptation of functional traits and their plasticity of three ornamental trees growing in urban environment. Sci. Hortic. 2021, 286, 110248. [Google Scholar] [CrossRef]
- Bierne, N.; Roze, D.; Welch, J.J. Pervasive selection or is it…? Why are FST outliers sometimes so frequent? Mol. Ecol. 2013, 22, 2061–2064. [Google Scholar]
- Garnier, E.; Navas, M.-L. A trait-based approach to comparative functional plant ecology: Concepts, methods and applications for agroecology. A review. Agron. Sustain. Dev. 2012, 32, 365–399. [Google Scholar] [CrossRef] [Green Version]
- Liu, C.; Li, Y.; Xu, L.; Chen, Z.; He, N. Variation in leaf morphological, stomatal, and anatomical traits and their relationships in temperate and subtropical forests. Sci. Rep. 2019, 9, 5803. [Google Scholar] [CrossRef] [Green Version]
- Chi, D.; Meerbeek, K.; Yu, K.; Degerickx, J.; Somers, B. Foliar optical traits capture physiological and phenological leaf plasticity in Tilia×euchlora in the urban environment. Sci. Total Environ. 2022, 805, 150219. [Google Scholar] [CrossRef]
- Mitu, K.J.; Islam, M.A.; Biswas, P.; Marzia, S.; Ali, M.A. Effects of different environmental pollutants on the anatomical features of roadside plants. Progress. Agric. 2019, 30, 344–351. [Google Scholar] [CrossRef]
- Andrianjara, I.; Bordenave-Jacquemin, M.; Roy, V.; Cabassa, C.; Federici, P.; Carmignac, D.; Marcangeli, Y.; Rouhan, G.; Renard, M.; Nold, F.; et al. Urban tree management: Diversity of Tilia genus in streets and parks of Paris based on morphological and genetic characteristics. Urban For. Urban Green. 2021, 66, 127382. [Google Scholar] [CrossRef]
- Wang, X.; Wang, X.; Chen, Y.; Berlyn, G.P. Photosynthetic parameters of urban greening trees growing on paved land. iForest—Biogeosci. For. 2019, 12, 403–410. [Google Scholar] [CrossRef] [Green Version]
- Rötzer, T.; Rahman, M.A.; Moser-Reischl, A.; Pauleit, S.; Pretzsch, H. Process based simulation of tree growth and ecosystem services of urban trees under present and future climate conditions. Sci. Total Environ. 2019, 676, 651–664. [Google Scholar] [CrossRef]
- Liu, Z.; Jiang, F.; Li, F.; Jin, G. Coordination of intra and inter-species leaf traits according to leaf phenology and plant age for three temperate broadleaf species with different shade tolerances. For. Ecol. Manag. 2019, 434, 63–75. [Google Scholar] [CrossRef]
- Demidchik, V. Mechanisms of oxidative stress in plants: From classical chemistry to cell biology. Environ. Exp. Bot. 2015, 109, 212–228. [Google Scholar] [CrossRef]
- Shanker, A.; Venkateswarlu, B. (Eds.) Abiotic Stress in Plants. Mechanisms and Adaptations; InTech: Rijeka, Croatia, 2011. [Google Scholar]
- McCarthy, D.M.; Mason-Gamer, R.J. Morphological variation in North American Tilia and its value in species delineation. Int. J. Plant Sci. 2020, 181, 175–195. [Google Scholar] [CrossRef]
- Phuekvilai, P.; Wolff, K. Characterization of microsatellite loci in Tilia platyphyllos (Malvaceae) and cross-amplification in related species. Appl. Plant Sci. 2013, 1, 1200386. [Google Scholar] [CrossRef] [PubMed]
- Gozukirmizi, N.; Yilmaz, S.; Marakli, S.; Temel, A. Retrotransposon-Based Molecular Markers; Tools for Variation Analysis in Plants. In Applications of Molecular Markers in Plant Genome Analysis and Breeding; Taški-Ajduković, K., Ed.; IntechOpen: Kolkata, India, 2015; pp. 19–45. [Google Scholar]
- Petrova, S. Efficiency of Pinus nigra J.F. Arnold in removing pollutants from urban environment (Plovdiv, Bulgaria). Environ. Sci. Pollut. Res. 2020, 27, 39490–39506. [Google Scholar] [CrossRef]
- Petrova, S.; Velcheva, I.; Nikolov, B.; Vasileva, T.; Bivolarski, V. Antioxidant Responses and Adaptation Mechanisms of Tilia tomentosa Moench, Fraxinus excelsior L. and Pinus nigra J. F. Arnold towards Urban Air Pollution. Forests 2022, 13, 1689. [Google Scholar] [CrossRef]
- Alue, B.A.; Salleh Hudin, N.; Mohamed, F.; Mat Said, Z.; Ismail, K. Plant Diversity along an Urbanization Gradient of a Tropical City. Diversity 2022, 14, 1024. [Google Scholar] [CrossRef]
- Khavaninzadeh, A.R.; Veroustraete, F.; Buytaert, J.A.N.; Samson, R. Leaf injury symptoms of Tilia sp. as an indicator of urban habitat quality. Ecol. Indic. 2014, 41, 58–64. [Google Scholar] [CrossRef]
- Petrova, S.; Velcheva, I.; Nikolov, B.; Marinov-Serafimov, P.; Golubinova, I.; Popov, V.; Valcheva, E.; Todorova, K. Assessment of the adaptation of some tree species to the urban environment (Plovdiv, Bulgaria). Comptes Rendus de L’Academie Bulgare des Sciences 2019, 72, 1676–1683. [Google Scholar]
- Haliloğlu, K.; Türkoğlu, A.; Öztürk, H.I.; Özkan, G.; Elkoca, E.; Poczai, P. iPBS-Retrotransposon Markers in the Analysis of Genetic Diversity among Common Bean (Phaseolus vulgaris L.) Germplasm from Türkiye. Genes 2022, 13, 1147. [Google Scholar] [CrossRef] [PubMed]
- Akçali Giachino, R.R. Investigation of the genetic variation of anise (Pimpinella anisum L.) using RAPD and ISSR markers. Genet. Resour. Crop Evol. 2020, 67, 763–780. [Google Scholar] [CrossRef]
- Silva, S.V.P.; Procunier, J.D. Genomic fingerprinting using the PCR-random amplified polymorphic DNA technique. In Methods of Gene Technology; Dale, J.W., Sanders, P.G., Eds.; JAI Press: Middlesex, UK, 1994; Volume 2, pp. 319–336. [Google Scholar]
- Denduangboripant, J.; Setaphan, S.; Suwanprasart, W.; Panha, S. Determination of Local Tobacco Cultivars Using ISSR Molecular Marker. Chiang Mai J. Sci. 2010, 37, 293–303. [Google Scholar]
- Kalendar, R.; Antonius, K.; Smykal, P.; Schulman, A.H. iPBS: A universal method for DNA fingerprinting and retrotransposon isolation. Theor. Appl. Genet. 2010, 121, 1419–1430. [Google Scholar] [CrossRef] [PubMed]
- STATISTICA (Data Analysis Software System), version 12; Computer Software; StatSoft Inc.: Tulsa, OK, USA, 2004.
- Ermakov, V.; Perelomov, L.; Khushvakhtova, S.; Tyutikov, S.; Danilova, V.; Safonov, V. Biogeochemical assessment of the urban area in Moscow. Environ. Monit. Assess. 2017, 189, 641. [Google Scholar] [CrossRef]
- Pan, R.; Wang, X.; Li, N. Plant Physiology; Higher Education Press: Beijing, China, 2012; pp. 69–119. [Google Scholar]
- Takagi, M.; Gyokusen, K. Light and atmospheric pollution affect photosynthesis of street trees in urban environments. Urban For. Urban Green. 2004, 2, 167–171. [Google Scholar] [CrossRef]
- Lenz, K.E.; Host, G.E.; Roskoski, K.; Noormets, A.; Sober, A.; Karnosky, D.F. Analysis of a Farquhar-von Caemmerer-Berry leaf-level photosynthetic rate model for Populus tremuloides in the context of modeling and measurement limitations. Environ. Pollut. 2010, 158, 1015–1022. [Google Scholar] [CrossRef]
- Wang, X.; Chen, Y.; Wang, X. Impact of land pavement on photosynthetic characteristics of common greening trees in Beijing, China. Chin. J. Appl. Ecol. 2017, 28, 2423–2430. (In Chinese) [Google Scholar]
- Brandon, R.N. Adaptation and Environment; Princeton University Press: Princeton, NJ, USA, 1990. [Google Scholar]
- Ahmad, P.; Wani, M.R. (Eds.) Physiological Mechanisms and Adaptation Strategies in Plants under Changing Environment; Springer: New York, NY, USA, 2014; Volume 2. [Google Scholar]
Figure 1.
Map of the city of Plovdiv (Bulgaria), locations (numbered red dots), and photos of the four experimental plots (black arrows connecting to the locations).
Figure 1.
Map of the city of Plovdiv (Bulgaria), locations (numbered red dots), and photos of the four experimental plots (black arrows connecting to the locations).

Figure 2.
Bi-plot graph resulting from principal component analysis (PCA) illustrating the correlation between measured variables (content of potentially toxic elements in tree leaves) and urbanization intensity.
Figure 2.
Bi-plot graph resulting from principal component analysis (PCA) illustrating the correlation between measured variables (content of potentially toxic elements in tree leaves) and urbanization intensity.

Figure 3.
Leaf injuries observed on trees growing at Plot 3 (very high urbanization intensity): (a) Tilia tomentosa; (b) Fraxinus excelsior; and (c) Pinus nigra.
Figure 3.
Leaf injuries observed on trees growing at Plot 3 (very high urbanization intensity): (a) Tilia tomentosa; (b) Fraxinus excelsior; and (c) Pinus nigra.

Figure 4.
Physiological plant traits: (a) intensity of photosynthesis (A, μmol m−2 s−1), (b) stomatal conductance (Gs,μmol m−2 s−1), and (c) intensity of transpiration (E, μmol m−2 s−1) in August 2020—six years after transplantation into the urban environment. Values with different letters indicate significant differences (p < 0.05).

Figure 5.
Bi-plot graph resulting from principal component analysis (PCA) illustrating the correlation between measured variables (leaf traits, photosynthesis, stomatal conductance, and transpiration) and urbanization intensity.
Figure 5.
Bi-plot graph resulting from principal component analysis (PCA) illustrating the correlation between measured variables (leaf traits, photosynthesis, stomatal conductance, and transpiration) and urbanization intensity.

Figure 6.
Results of the PCR analysis through the ISSR marker: (a) ISSR profiles of studied tree species with ISSR primer UBC 807; (b) diagram of the cluster analysis (UPGMA) on the basis of amplified polymorphic bands of experimental saplings in the PCR analysis. CP—cophenetic correlation, CP = 0.895. Legend: M—molecular marker; T—T. tomentosa genotypes; P—P. nigra genotypes; F—F. excelsior genotypes. Numbers 1, 2, 3, and 4 indicate the number of the experimental plot where the saplings were planted.

Figure 7.
Results of the PCR analysis of Tilia tomentosa through the iPBS markers: (a) PCR profiles of T. tomentosa genotypes with four iPBS primers (2087, 2238, 2243, and 2394); (b) dendrogram of the cluster analysis (UPGMA) on the basis of amplified polymorphic bands of experimental saplings in the PCR analysis, CP = 0.950. Legend: M—molecular marker; T1, T2, T3, T4—T. tomentosa genotypes from four experimental plots.

Figure 8.
Results of the PCR analysis of Pinus nigra through the iPBS markers: (a) PCR profiles of Pinus nigra genotypes with four iPBS primers (2087, 2238, 2243, and 2394); (b) dendrogram of the cluster analysis (UPGMA) on the basis of amplified polymorphic bands of experimental saplings in the PCR analysis, CP = 0.970. Legend: M—molecular marker; P1, P2, P3, P4—Pinus nigra genotypes from four experimental plots.

Figure 9.
Results of the PCR analysis of F. excelsior through the iPBS markers: (a) PCR profiles of F. excelsior genotypes with four iPBS primers (2087, 2238, 2243, and 2394); (b) dendrogram of the cluster analysis (UPGMA) on the basis of amplified polymorphic bands of experimental saplings in the PCR analysis, CP = 0.971. Legend: M—molecular marker; F1, F2, F3, F4—F. excelsior genotypes from four experimental plots.

Figure 10.
Bi-plot graph resulting from principal component analysis (PCA) showing the correlation between measured variables (iPBS and ISSR molecular markers) and urbanization intensity.
Figure 10.
Bi-plot graph resulting from principal component analysis (PCA) showing the correlation between measured variables (iPBS and ISSR molecular markers) and urbanization intensity.

Table 1.
Urbanization intensity evaluated on the basis of built-up area and traffic volume.
| Motor Traffic (Car Number per 10 min) | Built-Up Area (%) | Urbanization Intensity | Experimental Plot |
|---|---|---|---|
| 0–10 | 0–10 | Low | Plot 4 |
| 10–50 | 10–40 | Medium | Plot 2 |
| 50–150 | 40–70 | High | Plot 1 |
| >150 | >70 | Very high | Plot 3 |
Table 2.
Concentrations of some potentially toxic elements (PTEs) in tree leaves/needles (in mg/kg) before transplantation into the urban environment (Plovdiv City, Bulgaria).
Table 2.
Concentrations of some potentially toxic elements (PTEs) in tree leaves/needles (in mg/kg) before transplantation into the urban environment (Plovdiv City, Bulgaria).
| Plant Location | Plant Species | As mg/kg | Cd mg/kg | Cr mg/kg | Cu mg/kg | Mn mg/kg | Pb mg/kg | V mg/kg | Zn mg/kg |
|---|---|---|---|---|---|---|---|---|---|
| Nursery | T. tomentosa | 0.18 | 0.08 | 0.64 | 7.4 | 63 | 3.9 | 0.46 | 18 |
| F. excelsior | 0.32 | 0.04 | 0.29 | 11.2 | 43 | 1.4 | 0.20 | 18 | |
| P. nigra | 0.07 | 0.09 | 0.34 | 3.2 | 8 | 3.3 | 0.23 | 26 |
Table 3.
Concentrations of some potentially toxic elements (PTEs) in tree leaves/needles (in mg/kg) in August 2015—4 months after transplantation into the urban environment.
Table 3.
Concentrations of some potentially toxic elements (PTEs) in tree leaves/needles (in mg/kg) in August 2015—4 months after transplantation into the urban environment.
| Plant Species | Plant Location | As mg/kg | Cd mg/kg | Cr mg/kg | Cu mg/kg | Mn mg/kg | Pb mg/kg | V mg/kg | Zn mg/kg |
|---|---|---|---|---|---|---|---|---|---|
| T. tomentosa | Plot 1 | 0.4 | 0.13 | 0.34 | 5.5 | 60 | 6.1 | 0.31 | 17 |
| Plot 2 | 0.2 | 0.16 | 0.53 | 4.5 | 100 | 4.8 | 0.30 | 14 | |
| Plot 3 | 0.4 | 0.17 | 0.66 | 7.1 | 115 | 6.5 | 0.48 | 16 | |
| Plot 4 | 0.2 | 0.14 | 0.37 | 5.4 | 82 | 3.7 | 0.23 | 14 | |
| F. excelsior | Plot 1 | 0.6 | 0.09 | 0.34 | 19.4 | 55 | 2.1 | 0.18 | 17 |
| Plot 2 | 0.4 | 0.14 | 0.25 | 6.3 | 39 | 4.1 | 0.18 | 12 | |
| Plot 3 | 0.8 | 0.13 | 0.34 | 8.8 | 58 | 3.6 | 0.21 | 18 | |
| Plot 4 | 0.4 | 0.06 | 0.25 | 5.1 | 36 | 2.9 | 0.14 | 9 | |
| P. nigra | Plot 1 | 0.29 | 0.13 | 0.48 | 3.2 | 8 | 3.4 | 0.28 | 23 |
| Plot 2 | 0.10 | 0.14 | 0.58 | 2.4 | 10 | 5.7 | 0.20 | 22 | |
| Plot 3 | 0.32 | 0.11 | 0.54 | 3.5 | 7 | 5.0 | 0.27 | 29 | |
| Plot 4 | 0.10 | 0.07 | 0.40 | 2.2 | 5 | 2.7 | 0.18 | 18 |
Table 5.
Leaf traits at August 2020—6 years after transplantation into the urban environment.
| Plant Species | Plant Location | Leaf Injuries (Percentage) | Class Injuries (1—Low; 5—Very High) |
|---|---|---|---|
| T. tomentosa | Plot 1 | 5%–10% | 2 |
| Plot 2 | 20%–25% | 2 | |
| Plot 3 | 40%–45% | 3 | |
| Plot 4 | 0 | 1 | |
| F. excelsior | Plot 1 | 0 | 1 |
| Plot 2 | 10%–15% | 2 | |
| Plot 3 | 0 | 1 | |
| Plot 4 | 0 | 1 | |
| P. nigra | Plot 1 | 10%–15% | 2 |
| Plot 2 | 10%–15% | 2 | |
| Plot 3 | 25%–30% | 3 | |
| Plot 4 | 1%–3% | 1 |
Table 6.
Primer sequences and band scores for polymorphic iPBS reactions in tree species genotypes (AP = number of analyzed genotypes, PA = polymorphic genotypes, % PA = percentage of polymorphic genotypes, T = total number of bands, P = polymorphic bands, and % P = percentage of polymorphic bands obtained with PCR amplification of tree species genotypes).
| iPBS Primers | Sequence of Primers (5′→3′) [9] | Tree Species | AP | PA | % PA | T | Fragment Size (bp) | P | % P |
|---|---|---|---|---|---|---|---|---|---|
| iPBS—2087 | GCA ATG GAA CCA | T. tomentosa | 4 | 4 | 100 | 13 | 75–1000 | 12 | 92.3 |
| P. nigra | 4 | 4 | 100 | 9 | 75–1300 | 7 | 77.8 | ||
| F. excelsior | 4 | 4 | 100 | 9 | 75–1300 | 7 | 77.8 | ||
| iPBS—2238 | ACC TAG CTC ATG ATG CCA | T. tomentosa | 4 | 2 | 50 | 12 | 100–500 | 12 | 100 |
| P. nigra | 4 | 2 | 50 | 12 | 75–1300 | 10 | 83.3 | ||
| F. excelsior | 4 | 1 | 25 | 7 | 100–600 | 1 | 14.28 | ||
| iPBS—2243 | AGT CAG GCT CTG TTA CCA | T. tomentosa | 4 | 1 | 25 | 6 | 350–900 | 1 | 16.66 |
| P. nigra | 4 | 2 | 50 | 10 | 250–1300 | 2 | 20 | ||
| F. excelsior | 4 | 3 | 75 | 10 | 250–1000 | 3 | 30 | ||
| iPBS—2394 | GAG CCT AGG CCA | T. tomentosa | 4 | 4 | 100 | 17 | 100–1000 | 16 | 94.11 |
| P. nigra | 4 | 4 | 100 | 10 | 75–900 | 7 | 70 | ||
| F. excelsior | 4 | 4 | 100 | 8 | 100–700 | 4 | 50 |
Disclaimer/Publisher’s Note: The statements, opinions and data contained in all publications are solely those of the individual author(s) and contributor(s) and not of MDPI and/or the editor(s). MDPI and/or the editor(s) disclaim responsibility for any injury to people or property resulting from any ideas, methods, instructions or products referred to in the content. |
© 2023 by the authors. Licensee MDPI, Basel, Switzerland. This article is an open access article distributed under the terms and conditions of the Creative Commons Attribution (CC BY) license (https://creativecommons.org/licenses/by/4.0/).
Share and Cite
MDPI and ACS Style
Petrova, S.; Petkova, M. Plant Traits of Tilia tomentosa Moench, Fraxinus excelsior L., and Pinus nigra J.F.Arnold as a Proxy of Urbanization. Forests 2023, 14, 800. https://doi.org/10.3390/f14040800
AMA Style
Petrova S, Petkova M. Plant Traits of Tilia tomentosa Moench, Fraxinus excelsior L., and Pinus nigra J.F.Arnold as a Proxy of Urbanization. Forests. 2023; 14(4):800. https://doi.org/10.3390/f14040800
Chicago/Turabian StylePetrova, Slaveya, and Mariana Petkova. 2023. "Plant Traits of Tilia tomentosa Moench, Fraxinus excelsior L., and Pinus nigra J.F.Arnold as a Proxy of Urbanization" Forests 14, no. 4: 800. https://doi.org/10.3390/f14040800
Note that from the first issue of 2016, this journal uses article numbers instead of page numbers. See further details here.