The Assessment of Favourability and Spatio-Temporal Dynamics of Pinus Mugo in the Romanian Carpathians Using GIS Technology and Landsat Images

 ,
, 
 ,
,
Abstract
:1. Introduction
2. Database and Methodology
3. Results
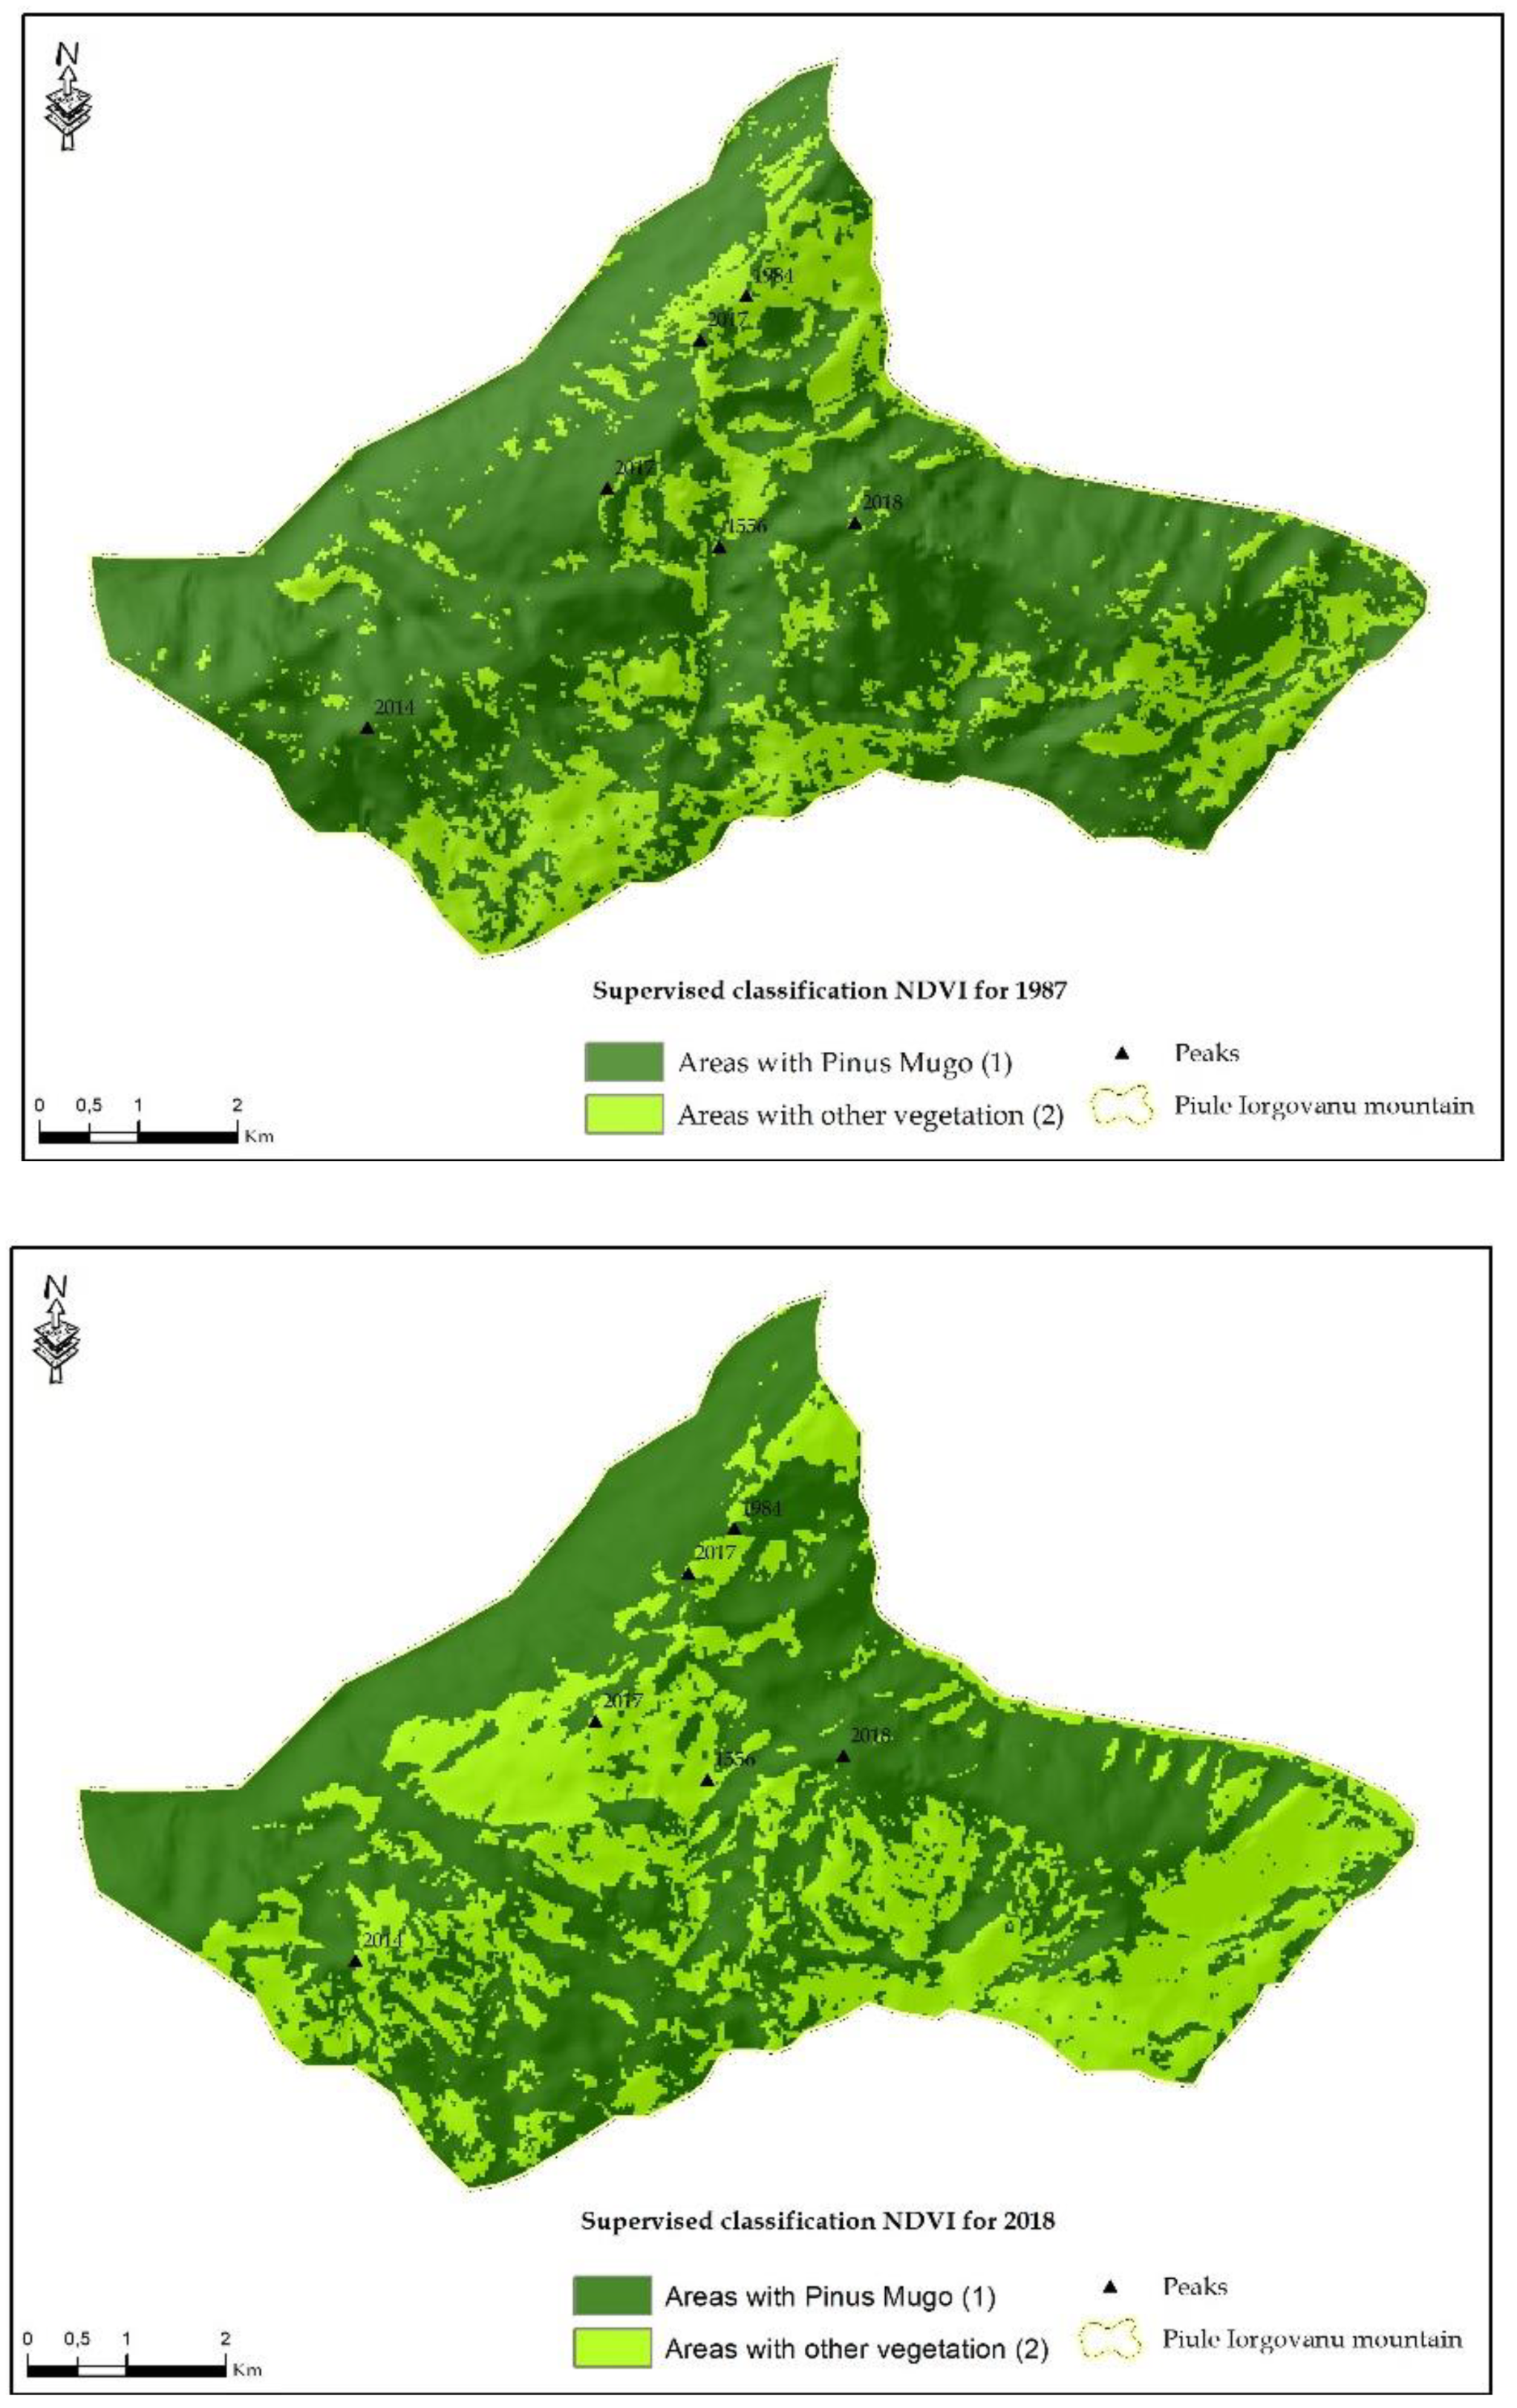
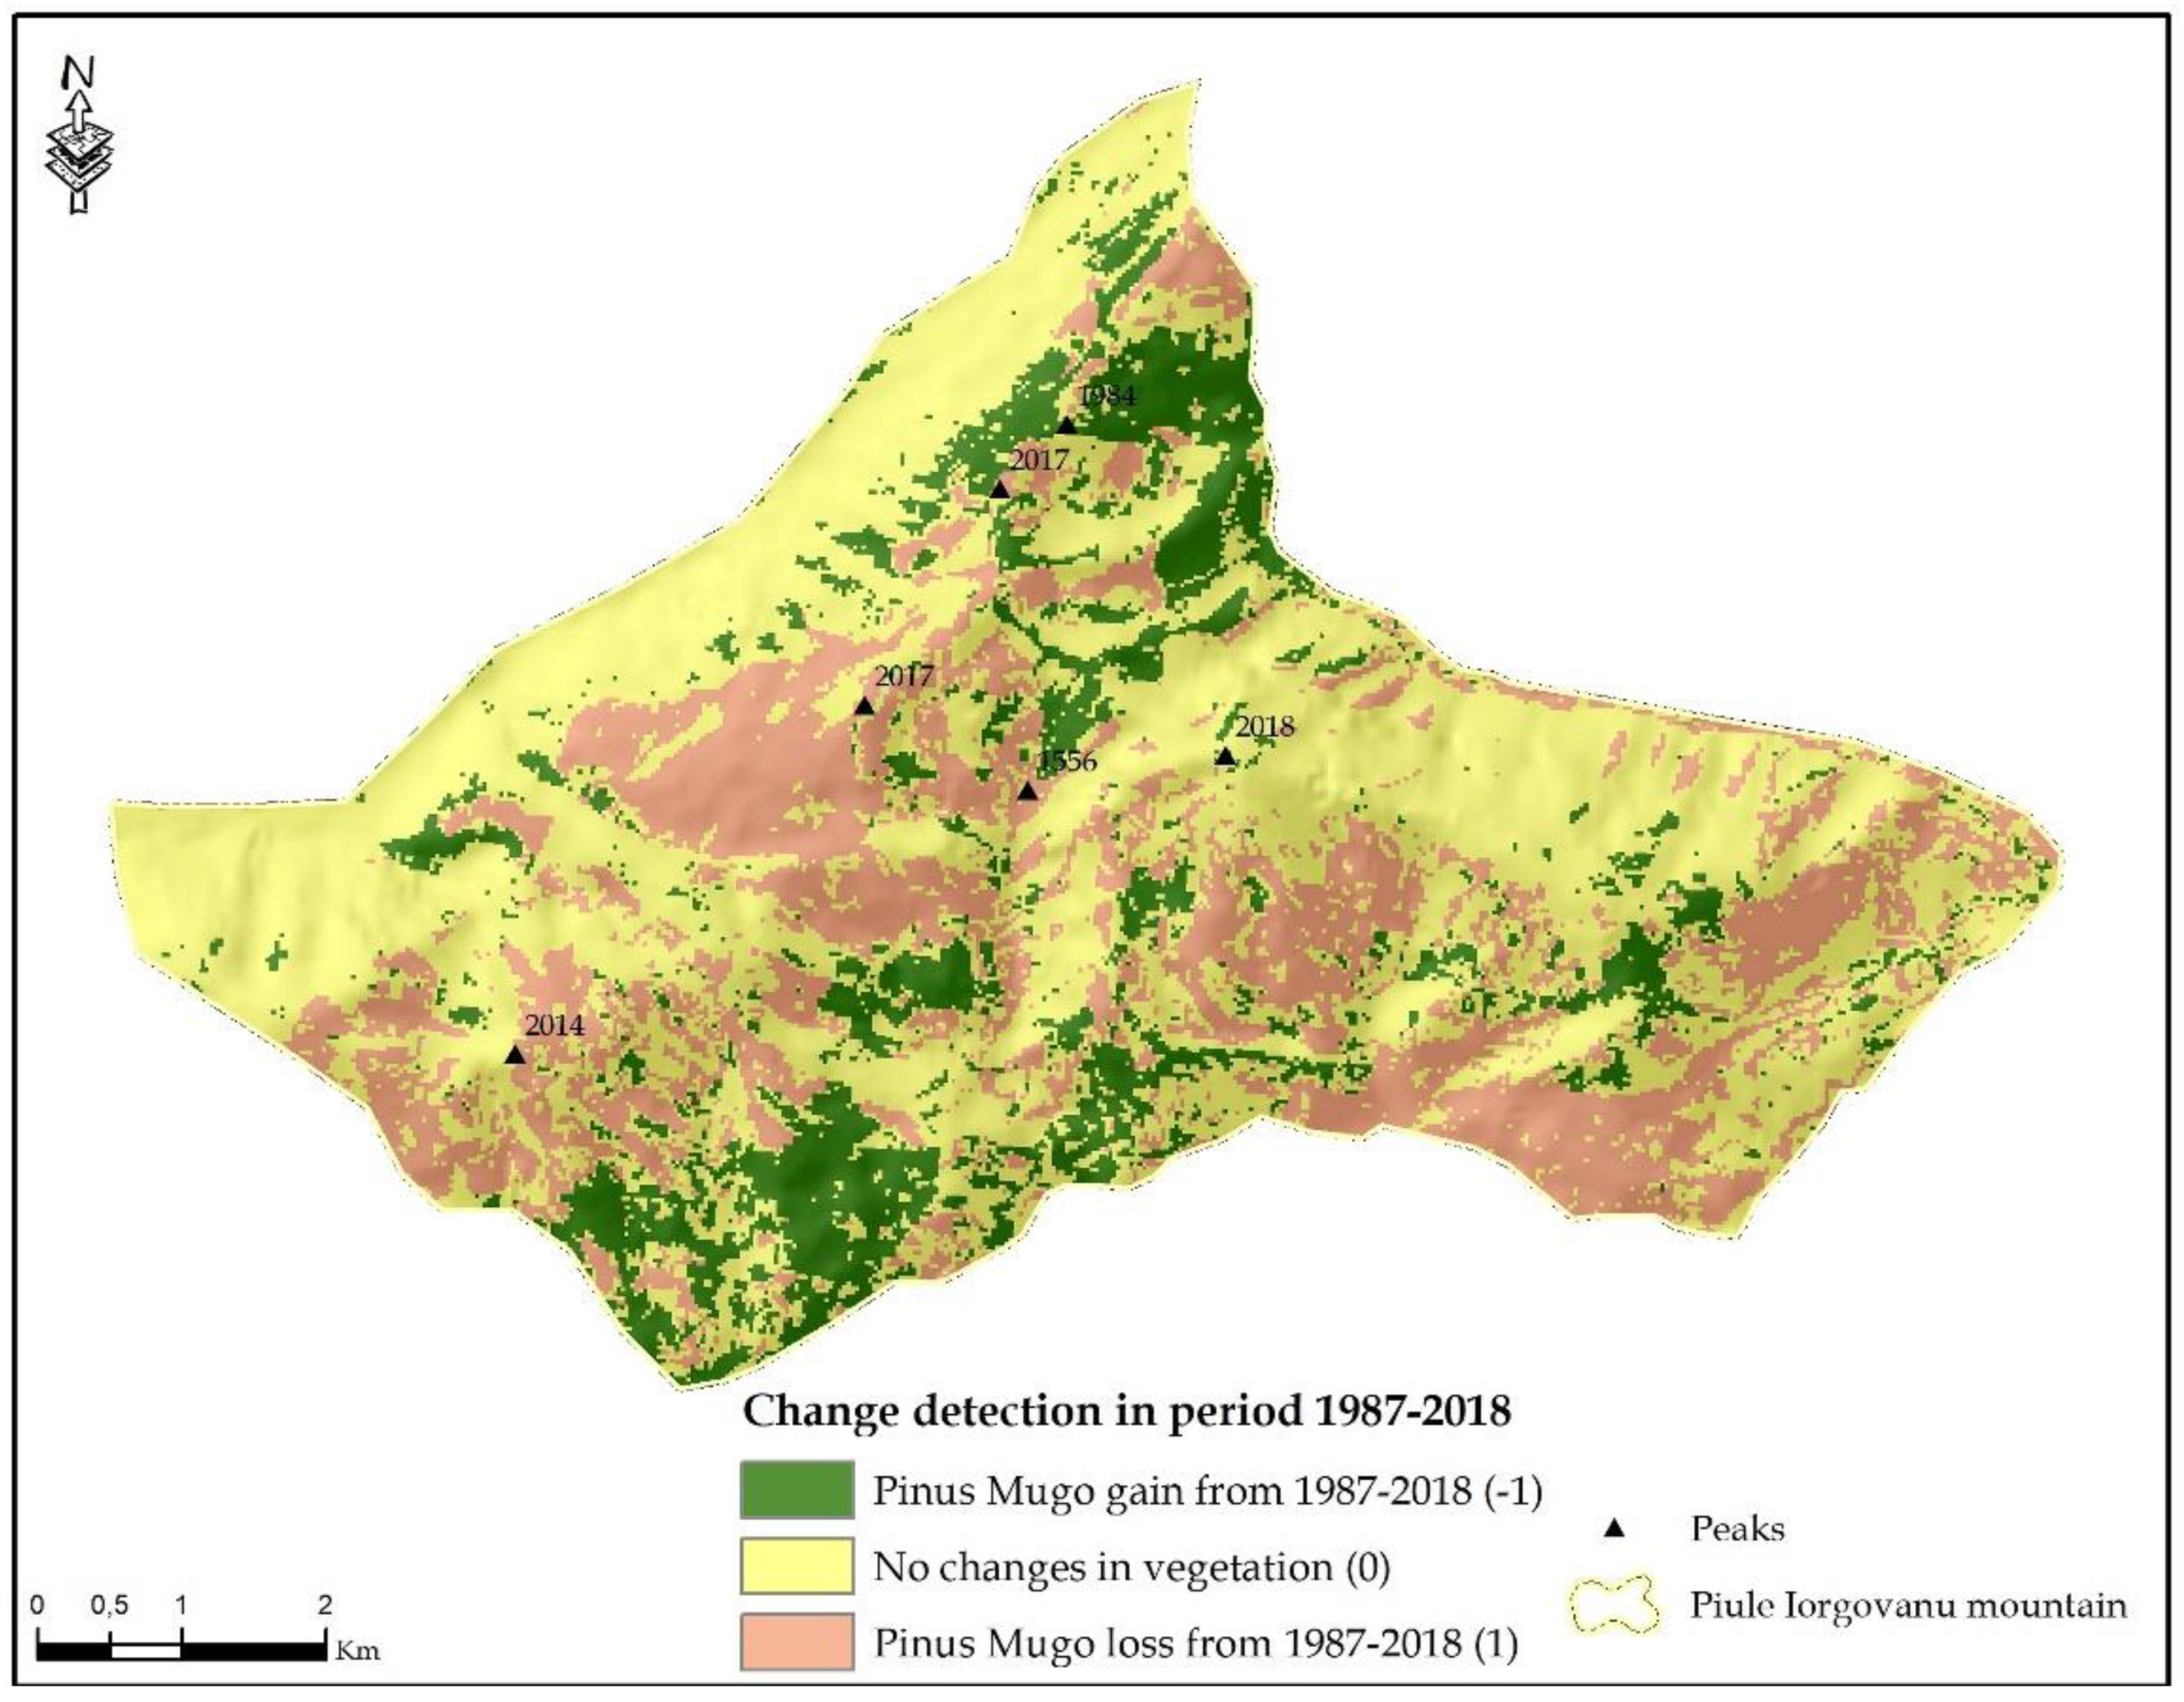
3.1. Spatio-Temporal Variability Assessment of Pinus Mugo Using Landsat Imagines
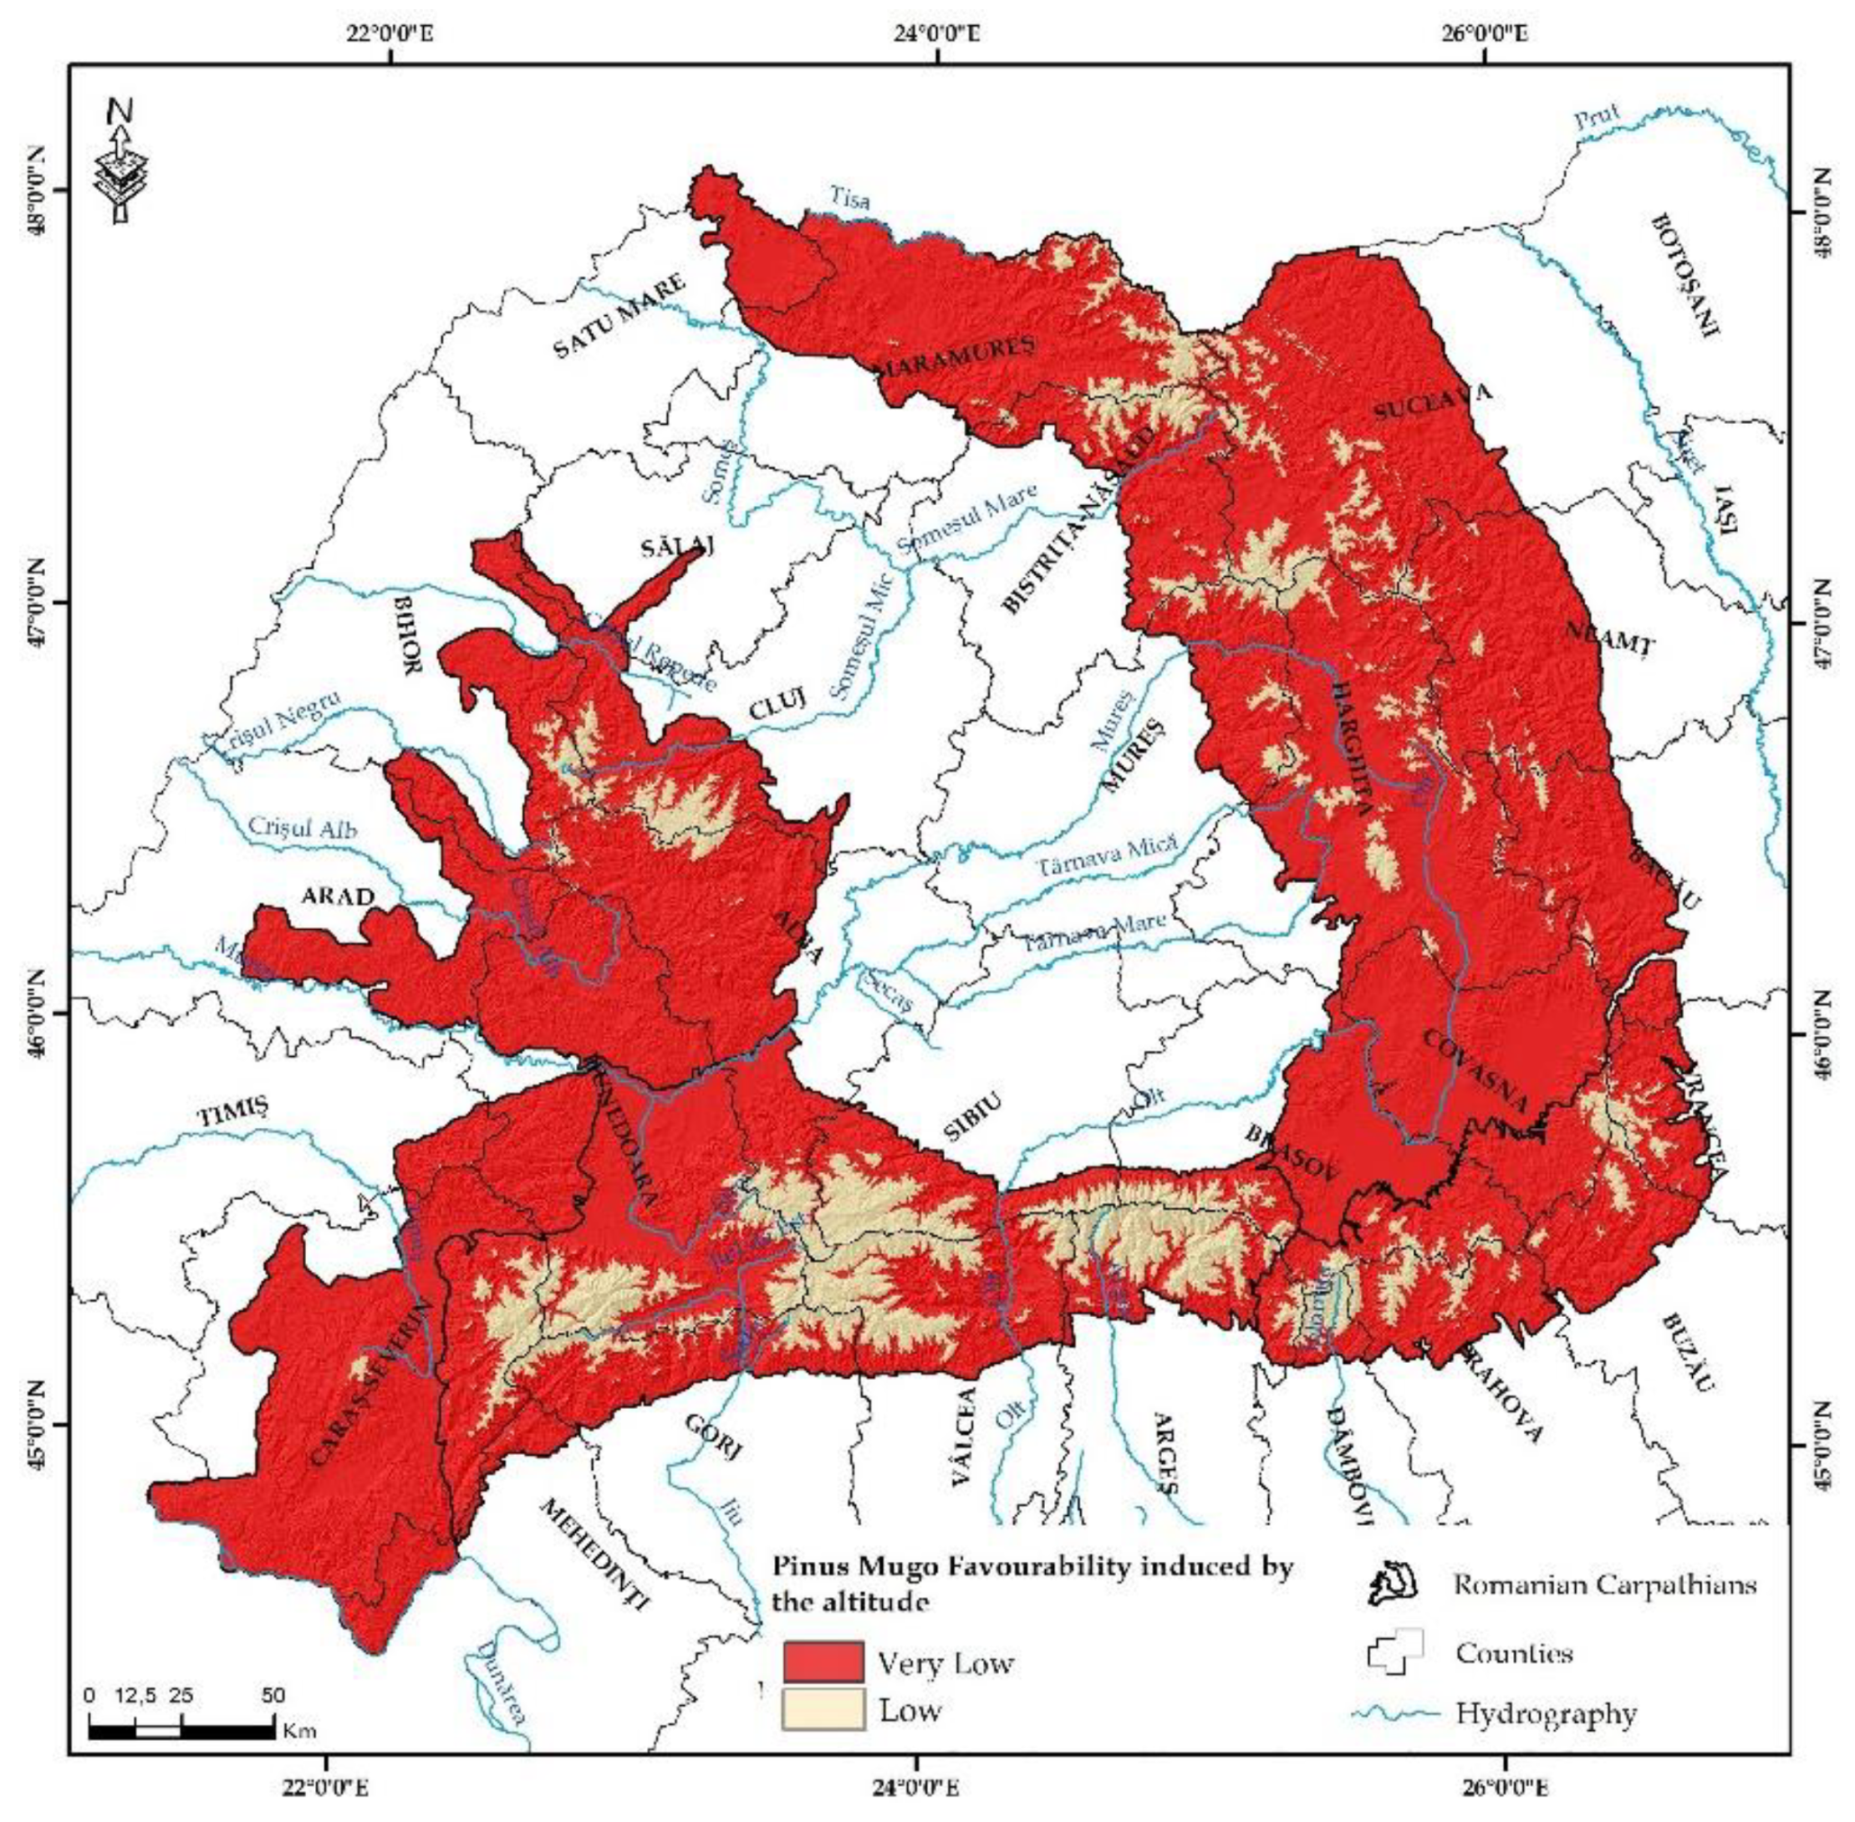
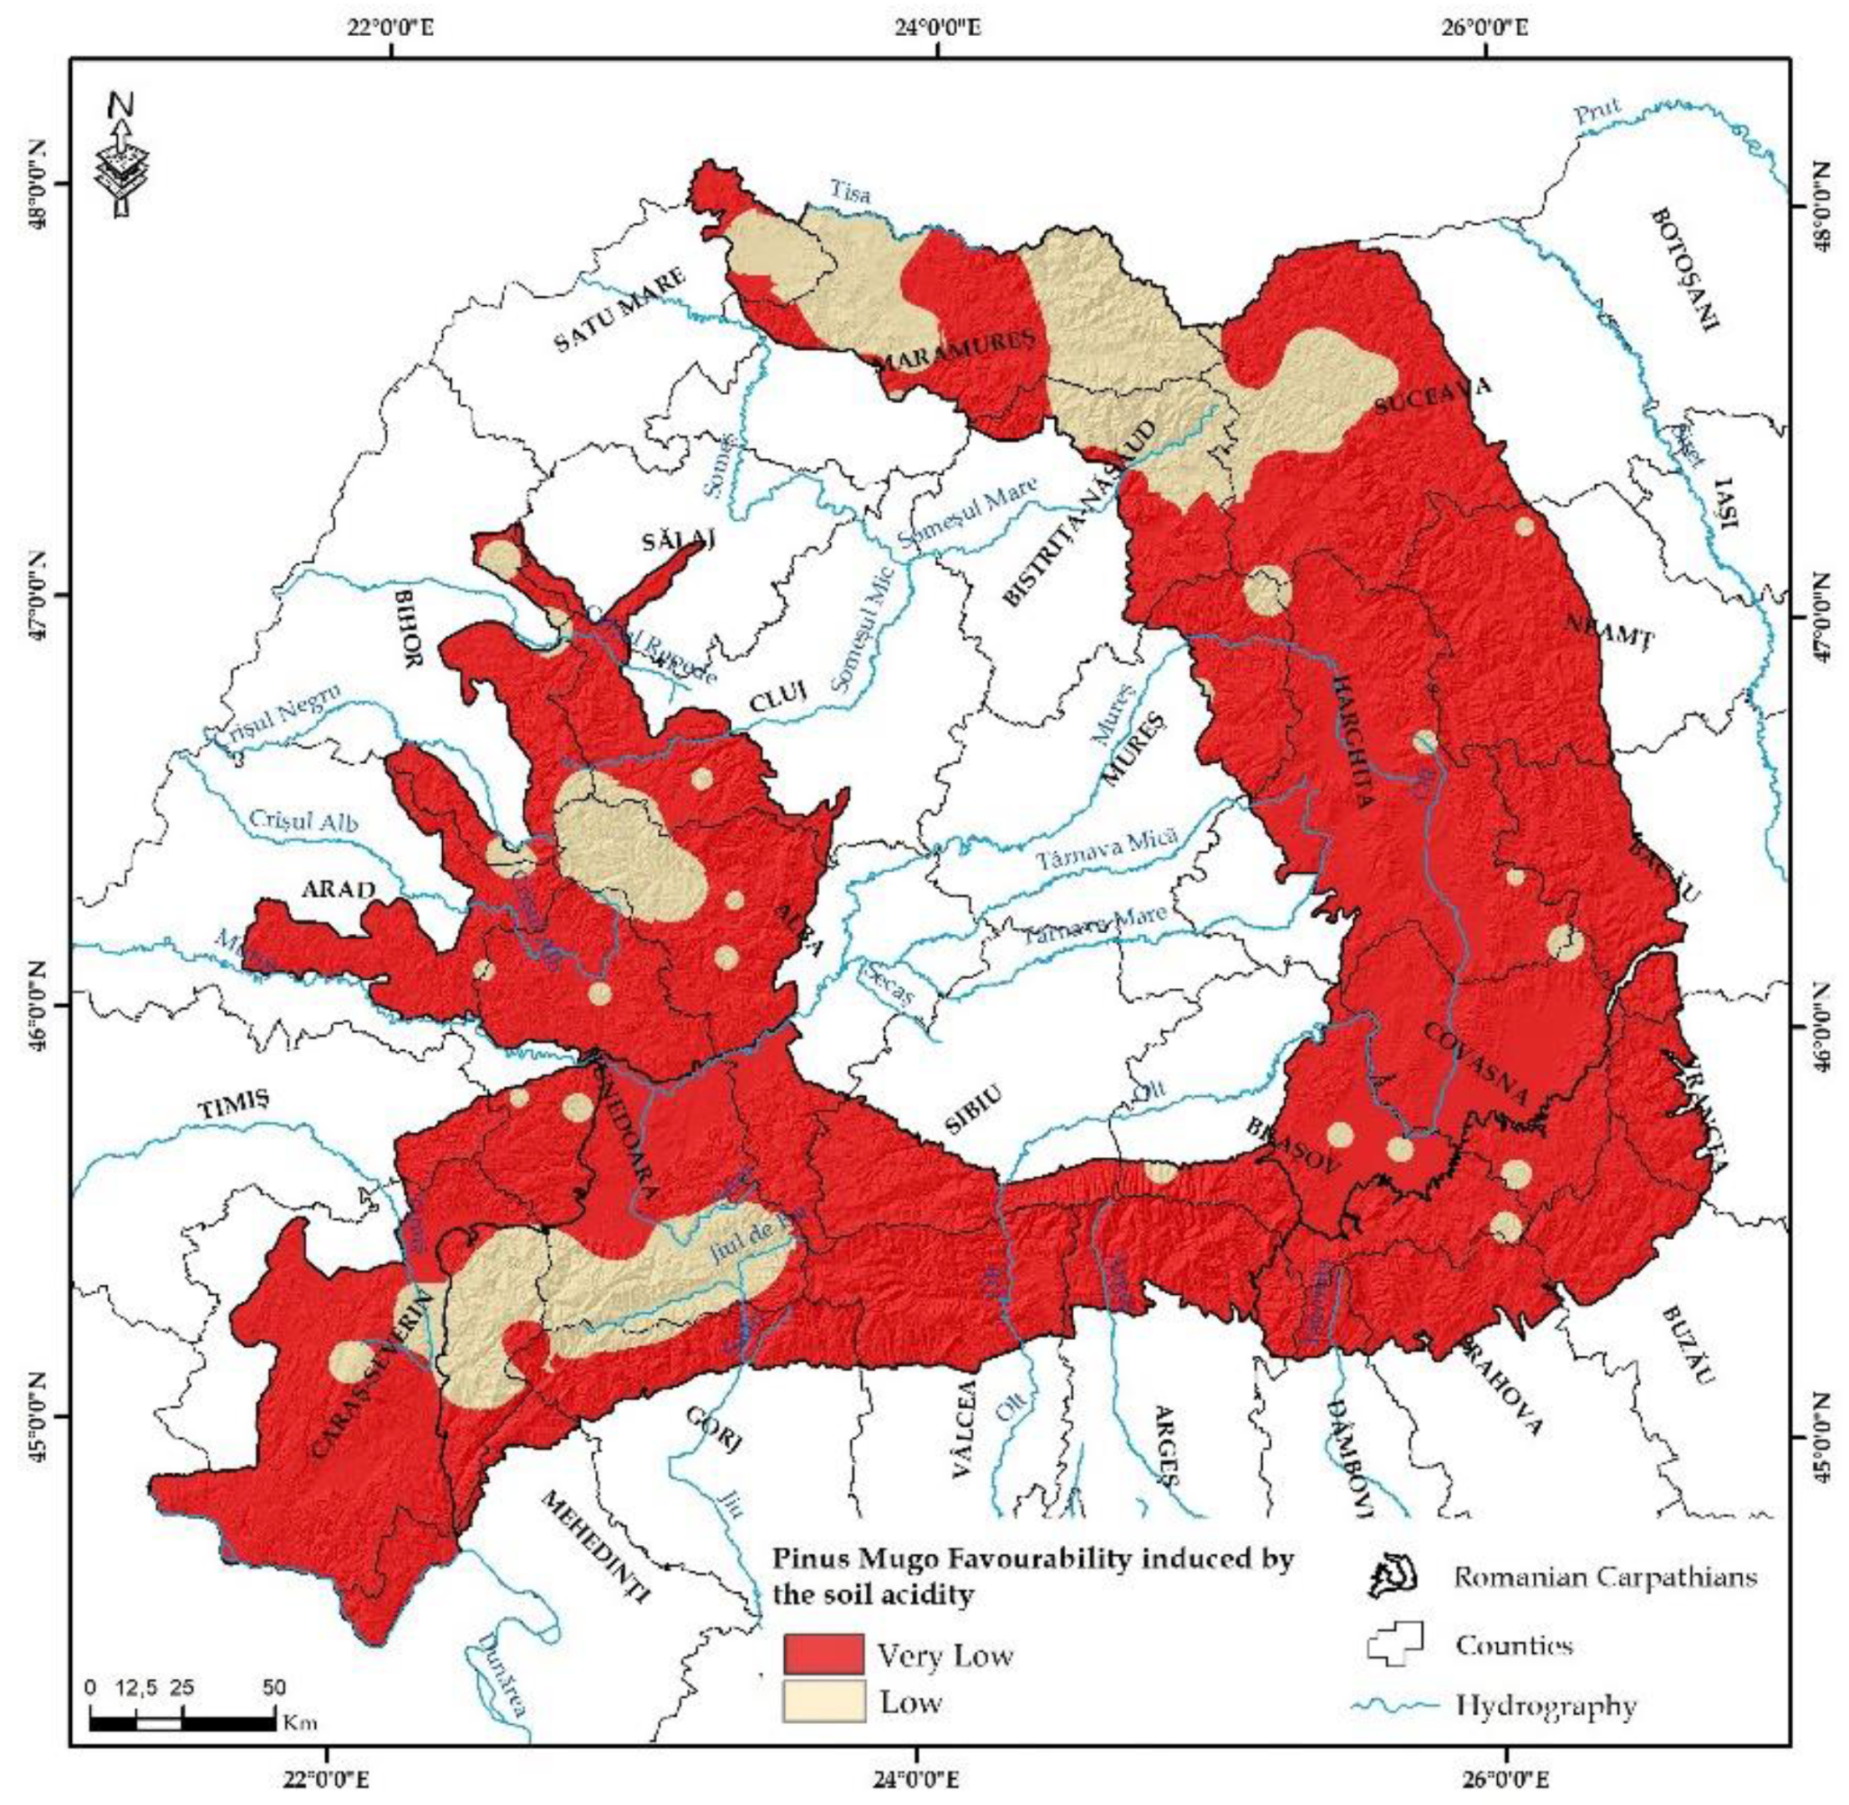
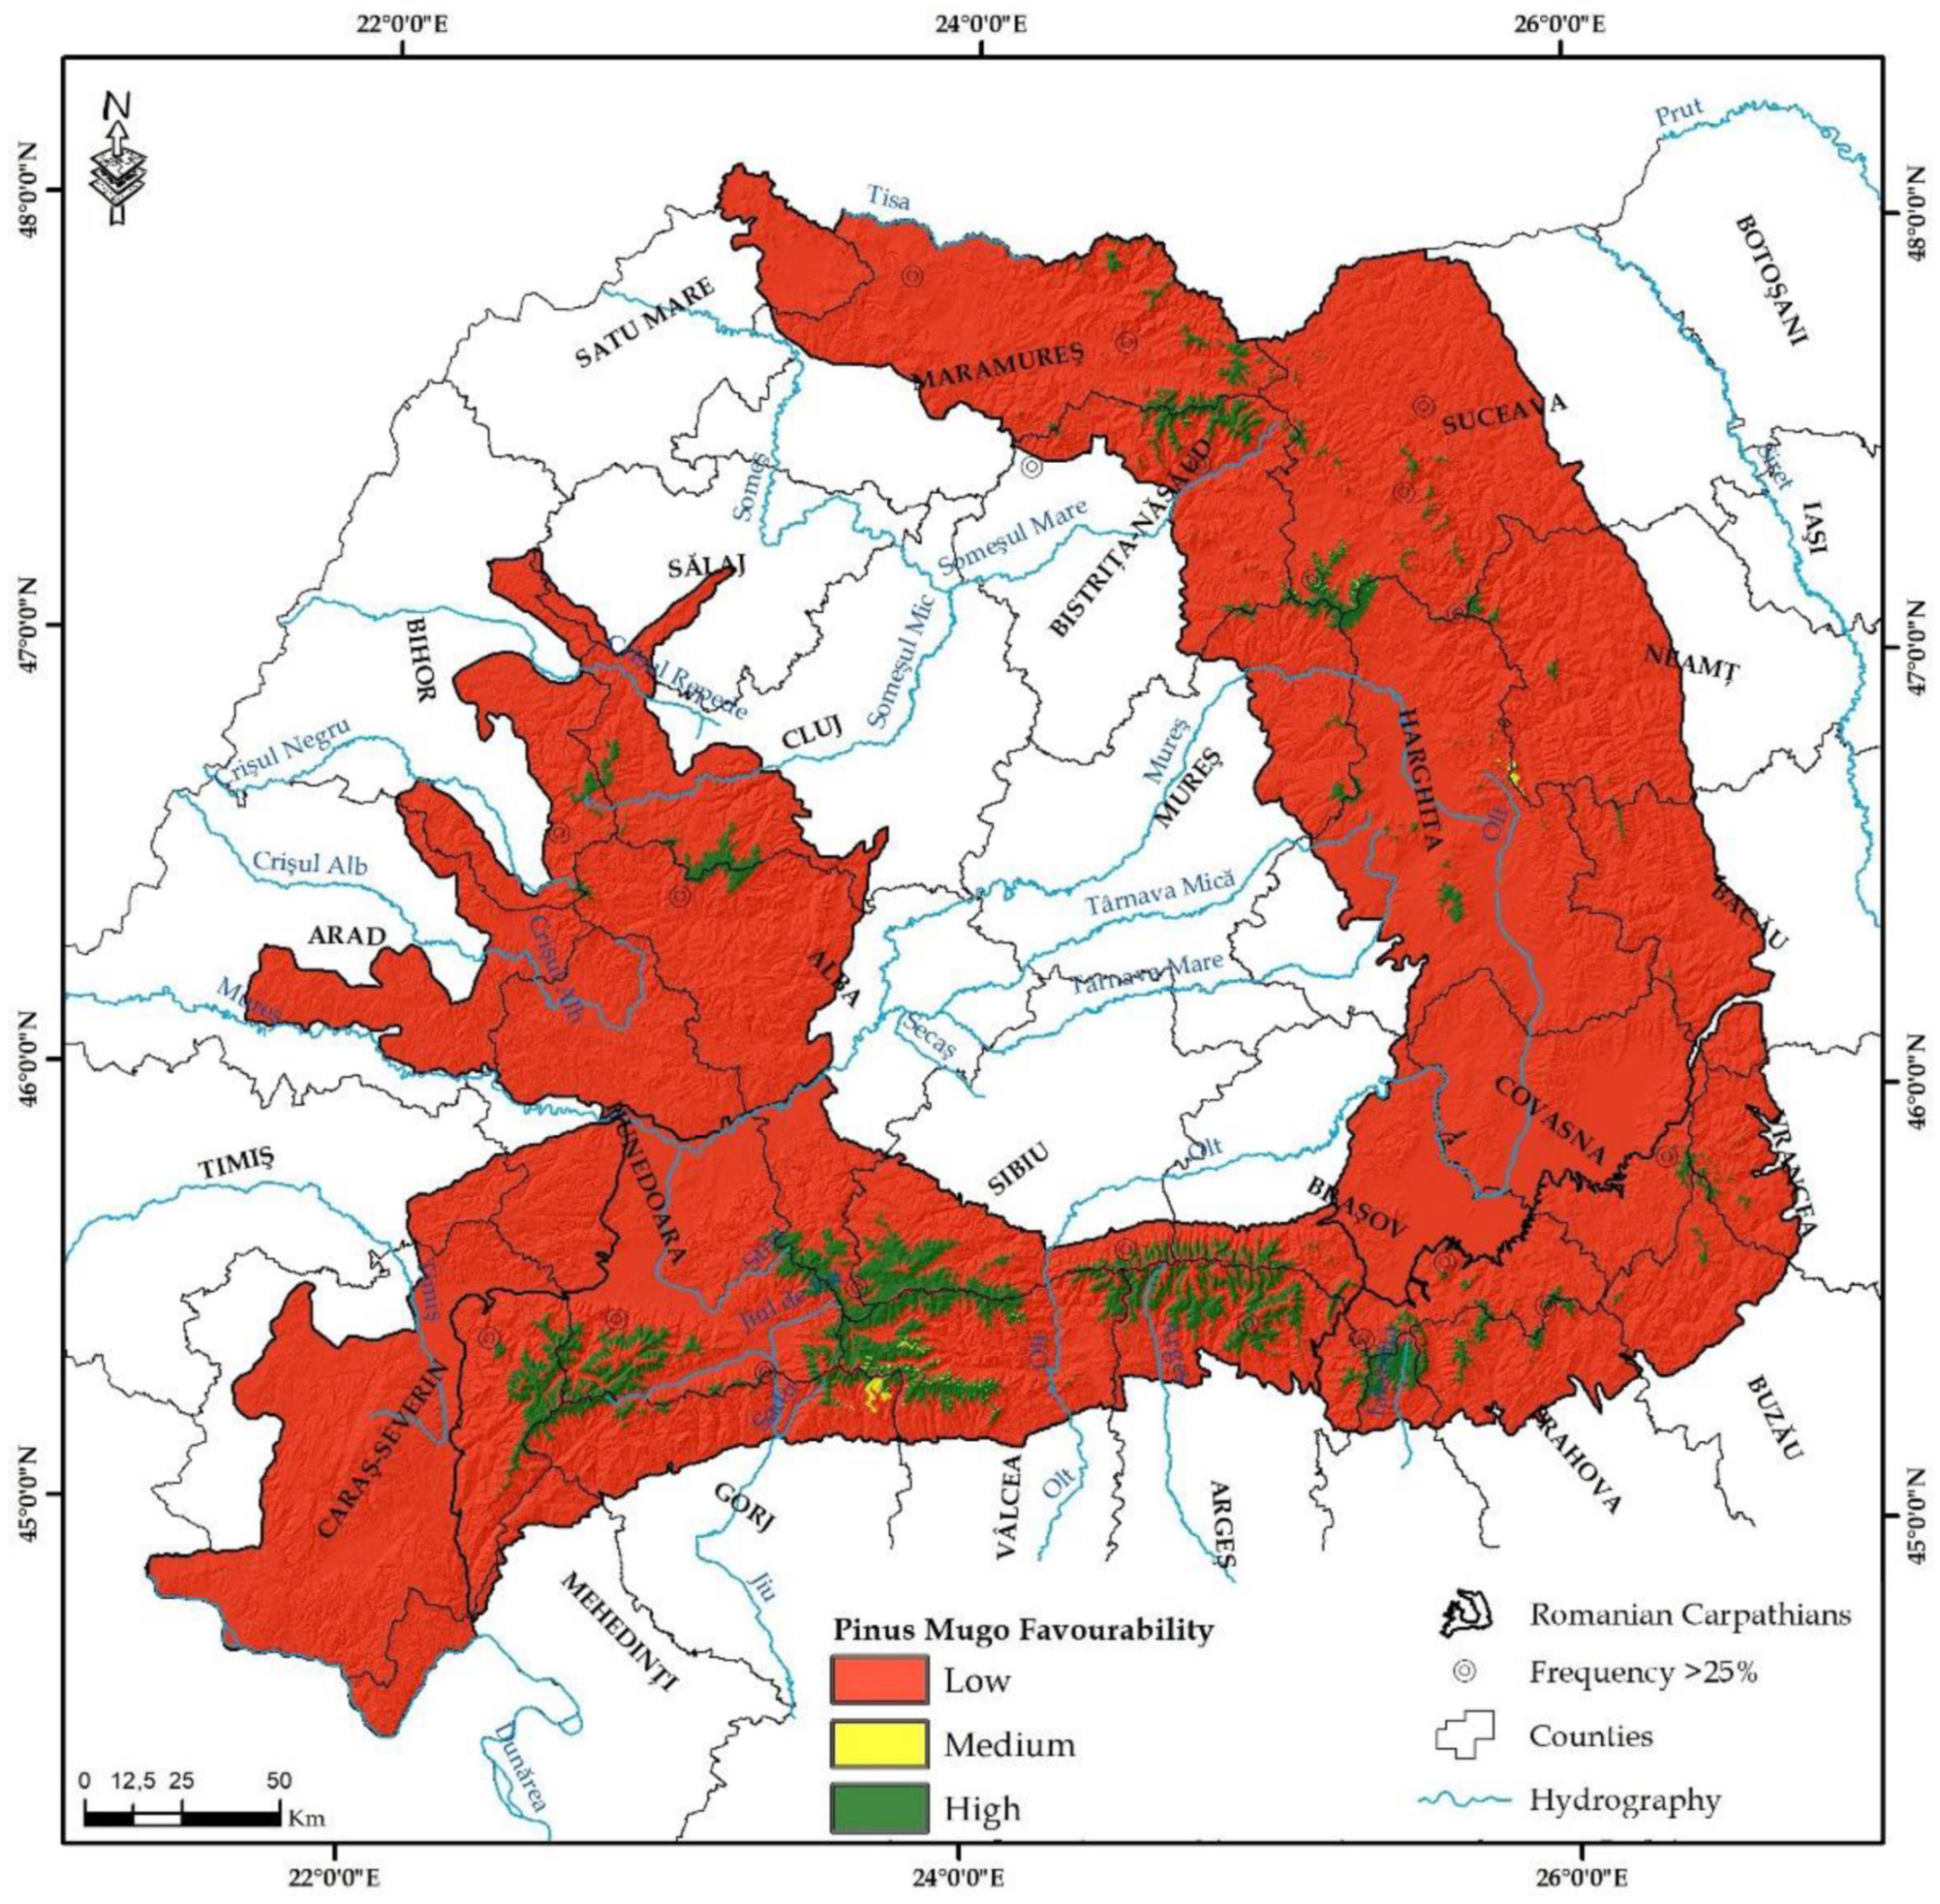
3.2. Identification of Favourability for Pinus Mugo in The Romanian Carpathian Area
4. Discussion
5. Conclusions
Author Contributions
Funding
Conflicts of Interest
References
- Hodor, C. Planul de Monitorizare a Habitatului 4070* Tufărişuri cu Pinus Mugo şi Rhododendron Myrtifolium din Siturile Reţelei Natura 2000 din România; Publisher Green Steps: Brașov, Romania, 2008; 32p. [Google Scholar]
- Doniţă, N.; Popescu, A.; Paucă-Comănescu, M.; Mihăilescu, S.; Biriş, I.A. Habitatele din România; Publisher Tehnică Silvică: București, Romania, 2005; 442p. [Google Scholar]
- Willner, W. Syntaxonomische Revision der südmitteleuropäischen Buchenwälder. Phytocoenologia 2002, 32, 337–453. [Google Scholar] [CrossRef]
- Knollová, I.; Chytrý, M. Oak-hornbeam forests of the Czech Republic: Geographical and ecological approaches to vegetation classification. Preslia 2004, 76, 291–311. [Google Scholar]
- Hájková, P.; Hájek, M.; Apostolova, I. Diversity of wetland vegetation in the Bulgarian high muntains, main gradients and context-dependence of the pH role. Plant Ecol. 2006, 184, 111–130. [Google Scholar] [CrossRef]
- Richardson, D.M.; Bond, W.J. Determinant of plant distribution: Evidence from pine invasions. Am. Nat. 1991, 137, 639–668. [Google Scholar] [CrossRef]
- Ali, A.; Martinez, M.; Fauvart, N.; Roiron, P.; Fioraso, G.; Guendon, J.-L.; Terral, J.-F.; Carcaillet, C. Incendies et peuplements à Pinus mugo Turra dans les Alpes occidentals (Val de Suse, Italie) durant la transition Tardiglaciaire–Holocène: Une zone refuge évidente. C. R. Biol. 2006, 329, 494–501. [Google Scholar] [CrossRef] [PubMed]
- Stanisci, A. Gli arbusteti altomontani dell’Appennino centrale e meridionale. Fitosociologia 1997, 34, 3–46. [Google Scholar]
- Businský, R. Agregát Pinus mugo v bývalém Československu—Taxonomie, rozšíření, hybridní populacea ohrožení. Zprávy České Botanické Společnosti 1998, 33, 29–52. [Google Scholar]
- Businský, R. Taxonomická studie agregátu Pinus mugo a jeho hybridných populácií. Acta Průhoniciana 1999, 68, 123–143. [Google Scholar]
- Boratyńska, K.; Marcysiak, K.; Boratyński, A. Pinus mugo (Pinaceae) in the Abruzzi Mountains: High morphological variation in isolated populations. Bot. J. Linn. Soc. 2005, 147, 309–316. [Google Scholar] [CrossRef]
- Šibík, J.; Dítě, D.; Šibíková, I.; Pukajová, D. Plant communities dominated by Pinus mugo agg. in Central Europe– comparison of the oligotrophic communities rich in Sphagnum. Phytocoenologia 2008, 38, 221–238. [Google Scholar] [CrossRef]
- Pignatti, E. Zum Problem der Höhenstufen und Vegetationszonen. Hytocoenologia 1980, 7, 52–64. [Google Scholar]
- Coldea, G.; Pânzaru, G. Vegetaţia rezervaţiei natural “Omul”din Munţii Suhardului. Studii şi cercetări de biologie. Seria Biologie Vegetală 1987, 39, 109–118. [Google Scholar]
- Coldea, G. Munţii Rodnei. Studiu Geobotanic; Academia Române: Bucureşti, Romania, 1990; 183p. [Google Scholar]
- Coldea, G. Prodrome des associations vegetales des Carpates du Sud-Est (Carpates Roumaines). Doc. Phytosociol. Nouv. Ser. 1991, 13, 317–539. [Google Scholar]
- Körner, C. Functional plant ecology of high mountain ecosystems. In Alpine Plant Life, 2nd ed.; Springer: Berlin/Heidelberg, Germany; New York, NY, USA, 2003; 344p. [Google Scholar]
- Deyl, M. Plants, soil and climate of Pop Ivan. Synecological study from Carpathian Ukraina. Opera Bot. Čech. 1940, 2, 1–290. [Google Scholar]
- Dai, L.; Palombo, C.; Van Gils, H.; Rosslter, D.; Tognetti, R.; Luo, G. Pinus mugo Krummholz Dynamics During Concomitant Change in Pastoralism and Climate in the Central Apennines. Mt. Res. Dev. 2017, 37, 75–86. [Google Scholar] [CrossRef]
- Motta, R.; Morales, M.; Nola, P. Human land-use, forest dynamics and tree growth at the treeline in the western Italian Alps. Ann. For. Sci. 2006, 63, 739–747. [Google Scholar] [CrossRef]
- Coldea, G.; Cristea, V. Floristic and community diversity of sub-alpine and alpine grasslands and grazed dwarf-shrub heaths in the Romanian Carpathians. Pirineos 1998, 151–152, 73–82. [Google Scholar] [CrossRef]
- Cristea, V. Fitosociologie şi Vegetaţia Românie [Phytosociology and the Vegetation of Romania]; Babeş-Bolyai University: Cluj Napoca, Romania, 1993. [Google Scholar]
- Feurdean, A.; Spessa, A.; Magyari, E.K. Trends in biomass burning in the Carpathian region over the last 15,000 years. Quat. Sci. Rev. 2012, 45, 111–125. [Google Scholar] [CrossRef]
- Toader, T.; Dumitru, I. Padurile Romaniei—Parcuri Nationale si Parcuri Naturale [Romania’s Forests—National Parks and Natural Parks]; Regia Nationala a Padurilor: Bucureşti, Romania, 2005. [Google Scholar]
- Stanescu, V. Dendrologie; Didactic and Pedagogical Publishing House: Bucharest, Romania, 1979; 471p. [Google Scholar]
- Šibík, J.; Valachovič, M.; Kliment, J. Plant communities with Pinus mugo (alliance Pinion mugo) in the subalpine belt of the Western Carpathians—A numerical approach. Acta Soc. Bot. Pol. 2005, 74, 329–343. [Google Scholar] [CrossRef]
- Ciocârlan, V. Flora ilustrată a României (Pteridophyta et Spermatophyta). In Illustrated Flora of Romania; Ceres: Bucharest, Romania, 2000; 1138p. [Google Scholar]
- Anderson, M.C.; Norman, J.M.; Mecikalski, J.R.; Torn, R.D.; Kustas, W.P.; Basara, J.B. A multi-scale remote sensing model for disaggregating regional fluxes to micrometeorological scales. J. Hydrometeorol. 2004, 5, 343–363. [Google Scholar] [CrossRef]
- Amiri, R.; Weng, Q.; Alimohammad, A.; Alavipanah, S.K. Spatial–temporal dynamics of land surface temperature in relation to fractional vegetation cover and land use/cover in the Tabriz urban area, Iran. Remote Sens. Environ. 2009, 113, 2606–2617. [Google Scholar] [CrossRef]
- Chakraborthy, A.; Sehgal, V.K. Assessment of agricultural drought using MODIS derived normalized difference water index. J. Agric. Phys. 2010, 10, 28–36. [Google Scholar]
- Sruthi, S.; Mohammed Aslam, M.A. Agricultural drought analysis using the NDVI and land surface temperature data: A case study of Raichur District, International conference on water resources, coastal and ocean engineering. Aquat. Procedia 2015, 4, 1258–1264. [Google Scholar] [CrossRef]
- Roșca, F. Variabilitate Climatică și Efecte Induse Asupra Utilizării Terenurilor în Câmpia Română (Sectorul Jiu—Olt). Ph.D. Thesis, Babeș-Bolyai Universy, Cluj Napoca, Romania, 2017. [Google Scholar]
- Mindru, M.; Roșca, S.; Bilașco, Ș.; Păcurar, I.; Fodorean, I.; Vescan, I.; Petrea, D.; Breje, M. The monitoring of forest coverage changes according to the remote sensing indices in the the Mociar forest. Geogr. Napoc. 2018, 1, 27–34. [Google Scholar]
- Zhou, L.; Tucker, C.J.; Kaufmann, R.K.; Slayback, D.; Shabanov, N.V.; Myneni, R.B. Variations in northern vegetation activity inferred from satellite data of vegetation index during 1981 to 1999. J. Geophys. Res. 2001, 106, 20069–20083. [Google Scholar] [CrossRef]
- Bunn, A.G.; Goetz, S.J.; Fiske, G.J. Observed and predicted responses of plant growth to climate across Canada. Geophys. Res. Lett. 2005, 32, L16710. [Google Scholar] [CrossRef]
- Meng, M.; Ni, J.; Zong, M. Impacts of changes in climate variability on regional vegetation in China: NDVI-based analysis from 1982 to 2000. Ecol. Res. 2011, 26, 421–428. [Google Scholar] [CrossRef]
- Dragotă, C.S.; Kucsicsa, G. Global climate change-related particularities in the Rodnei Mountains National Park. Carpathian J. Earth Environ. Sci. 2011, 6, 43–50. [Google Scholar]
- Wrzesień, M.; Zagajewski, B.; Sobczak, M.; Zwijacz-Kozica, T. Estimation of Leaf Area Index in Dwarf Mountain Pine (Pinus Mugo Turra) Using Hyperspectral Data. In Proceedings of the 4th EARSeL Workshop on Imaging Spectroscopy. New Quality in Environmental Studies, Warsaw, Poland, 27–29 April 2005; Zagajewski, B., Sobczak, M., Wrzesień, M., Eds.; EARSeL: Münster, Germany, 2014; pp. 737–744. [Google Scholar]
- Diaz-Delgado, R.; Lloret, F.; Pons, X.; Terradas, J. Satellite evidence of creasing resilience in Mediterranean plant communities after recurrent wildfires. Ecology 2002, 83, 2293–2303. [Google Scholar] [CrossRef]
- Hicke, J.; Asner, G.; Kasischke, E.; French, N.; Randerson, J.; Collatz, G. Post fire response of North American boreal forest net primary productivity analyzed with satellite observations. Glob. Chang. Biol. 2003, 9, 1145–1157. [Google Scholar] [CrossRef]
- Lentile, L.; Holden, A.; Smith, A.; Falkowski, M.; Hudak, A.; Morgan, P.; Lewis, S.; Gessler, P.; Benson, N. Remote sensing techniques to assess active fire characteristics and post-fire effects. Int. J. Wildland Fire 2006, 15, 319–345. [Google Scholar] [CrossRef]
- Van Leeuwen, W. Monitoring the effects of forest restoration treatments on post-fire vegetation recovery with MODIS multitemporal data. Sensors 2008, 8, 2017–2042. [Google Scholar] [CrossRef] [PubMed]
- Cuevas-Gonzalez, M.; Gerard, F.; Balzter, H.; Riano, D. Analyzing forest ecovery after wildfire disturbance in boreal Siberia using remotely sensed vegetation indices. Glob. Chang. Biol. 2009, 15, 561–577. [Google Scholar] [CrossRef]
- Frolking, S.; Palace, M.; Clark, D.; Chambers, J.; Shugart, H.; Hurtt, G. Forest disturbance and recovery: A general review in the context of spaceborne remote sensing of impacts on aboveground biomass and canopy structure. J. Geophys. Res. 2009, 114, 1–27. [Google Scholar] [CrossRef]
- Bruma, B. Evaluating the utility and seasonality of NDVI values for assessing post-disturbance recovery in a subalpine forest. Environ. Monit. Assess. 2012, 184, 3849–3860. [Google Scholar] [CrossRef]
- Fiorella, M.; Ripple, W.J. Determining Successional Stateof Temperate Coniferous Forests with Landsat Satellite Data. Photogramm. Eng. Remote Sens. 1993, 59, 239–246. [Google Scholar]
- Ripple, W. Determining Coniferous Forest Cover and Forest Fragmentation with OAH-9 Advanced Very High Resolution Radiometer Data. Photogramm. Eng. Remote Sens. 1994, 60, 533–540. [Google Scholar]
- Fernández-Manso, A.; Quintano, C.; Fernández-Manso, O. Forecast of NDVI in coniferous areas using temporal ARIMA analysis and climatic data at a regional scale. Int. J. Remote Sens. 2011, 32, 1595–1617. [Google Scholar] [CrossRef]
- Hansen, M.C.; Potapov, P.V.; Moore, R.; Hancher, M.; Turubanova, S.A.; Tyukavina, A.; Thau, D.; Stehman, S.V.; Goetz, S.J.; Loveland, T.R.; et al. High-resolution global maps of 21st-century forest cover change. Science 2013, 342, 850–853. [Google Scholar] [CrossRef]
- Niță, M.D.; Candrea-Bozga, B.Ș.; Clinciu, I. Posibilități de monitorizare a stării funcțiilor de protecție hidrologică și antierozională prin analize geospațiale. Revista Pădurilor 2015, 5–6, 66–74. [Google Scholar]
- Roșca, S.; Bilașco, Ș.; Păcurar, I.; Colniță, D.; Fodorean, I.; Vescan, I.; Petrea, D.; Păcurar, H. Quantitative evaluation of forest favourability using GIS database in a hill area in the Transylvania Depression, Romania. Geomat. Nat. Hazards Risk 2017, 8, 1914–1934. [Google Scholar] [CrossRef] [Green Version]
- Horvat, I.; Pawłowski, B.; Walas, J. Phytosociologische Studien über die Hochgebirgsvegetation der Rila Planina in Bulgarien, Studia fitosocjologiczne nad wysokogórska róslinnoscia gór Riła w Bułgarii; Académie Polonaise des Sciences et des Lettres: Krakow, Poland, 1937; pp. 159–189. [Google Scholar]
- Kočí, M.; Chytrý, M.; Tichý, L. Formalized reproduction of an expert-based phytosociological classification: A case study of subalpine tall-forb vegetation. J. Veg. Sci. 2003, 14, 601–610. [Google Scholar] [CrossRef]
- Černá, L.; Chytrý, M. Supervised classification of plant communities with artificial neural networks. J. Veg. Sci. 2005, 16, 407–414. [Google Scholar] [CrossRef]
- Bispo, R.C.; Petrini, M.A.; Lamparelli, R.A.C.; Rocha, J.V. Supervised Classification Applied to Vegetation Mapping in the Barão De Melgaço Municipality (Mato Grosso State, Brazil), Using Modis Imagery. Geogr. Rio Claro 2013, 38, 9–23. [Google Scholar]
- Tichy, L.; Chytry, M.; Botta-Duk, Z. Semi-supervised classification of vegetation: Preserving the good old units and searching for new ones. J. Veg. Sci. 2014, 25, 1504–1512. [Google Scholar] [CrossRef]
- San-Miguel-Ayanz, J.; De Rigo, D.; Caudullo, G.; Houston Durrant, T.; Mauri, A. (Eds.) European Atlas of Forest Tree Species; Publication Office of the European Union: Luxembourg, 2016. [Google Scholar]


| Ecological Factor | Favourabily | Interval for the Study Area | ||
|---|---|---|---|---|
| Very Low | Low | |||
| 1. | Average annual temperature (°C) | <2 °C; >3 °C | −1–3 °C | −2.3–10.4 °C |
| 2. | Average annual precipitation (mm/year) | <900 >1400 | 901–1400 | 557–1620 |
| 3. | Length of bioactive period (months) | >4 | 1–4 | 0.6–6 months |
| 4. | Relative atmospheric humidity -July | <75 | >75 | 66–91 |
| 5. | Wind (Beaufort degrees) | 1,2,3,4,5 | 6,7 | 3.9–36.7 km |
| 6. | Altitude (m) | <1300 | >1300 | 56–2544 m |
| 7. | Slope exposure | Flat surfaces | All exposures | All exposures |
| 8. | Saturation degree of bases in soil (V%) | >45 | <45 | 0.002–82 |
| 9. | Soil acidity (pH in water) | 5.4–7.2 | 5.4–3.6 | 4.3–8.2 |
| 10. | Azote supply (V = 0.01) | >4 | <4 | 1.06–7.11 |
| 11. | Edaphic volume (m3/m2) | >0.45 | <0.45 | 0.17–1.67 |
| 12. | Water supply capacity (%) | <12; >20 | 10.1–20 | 1.8–20.9 |
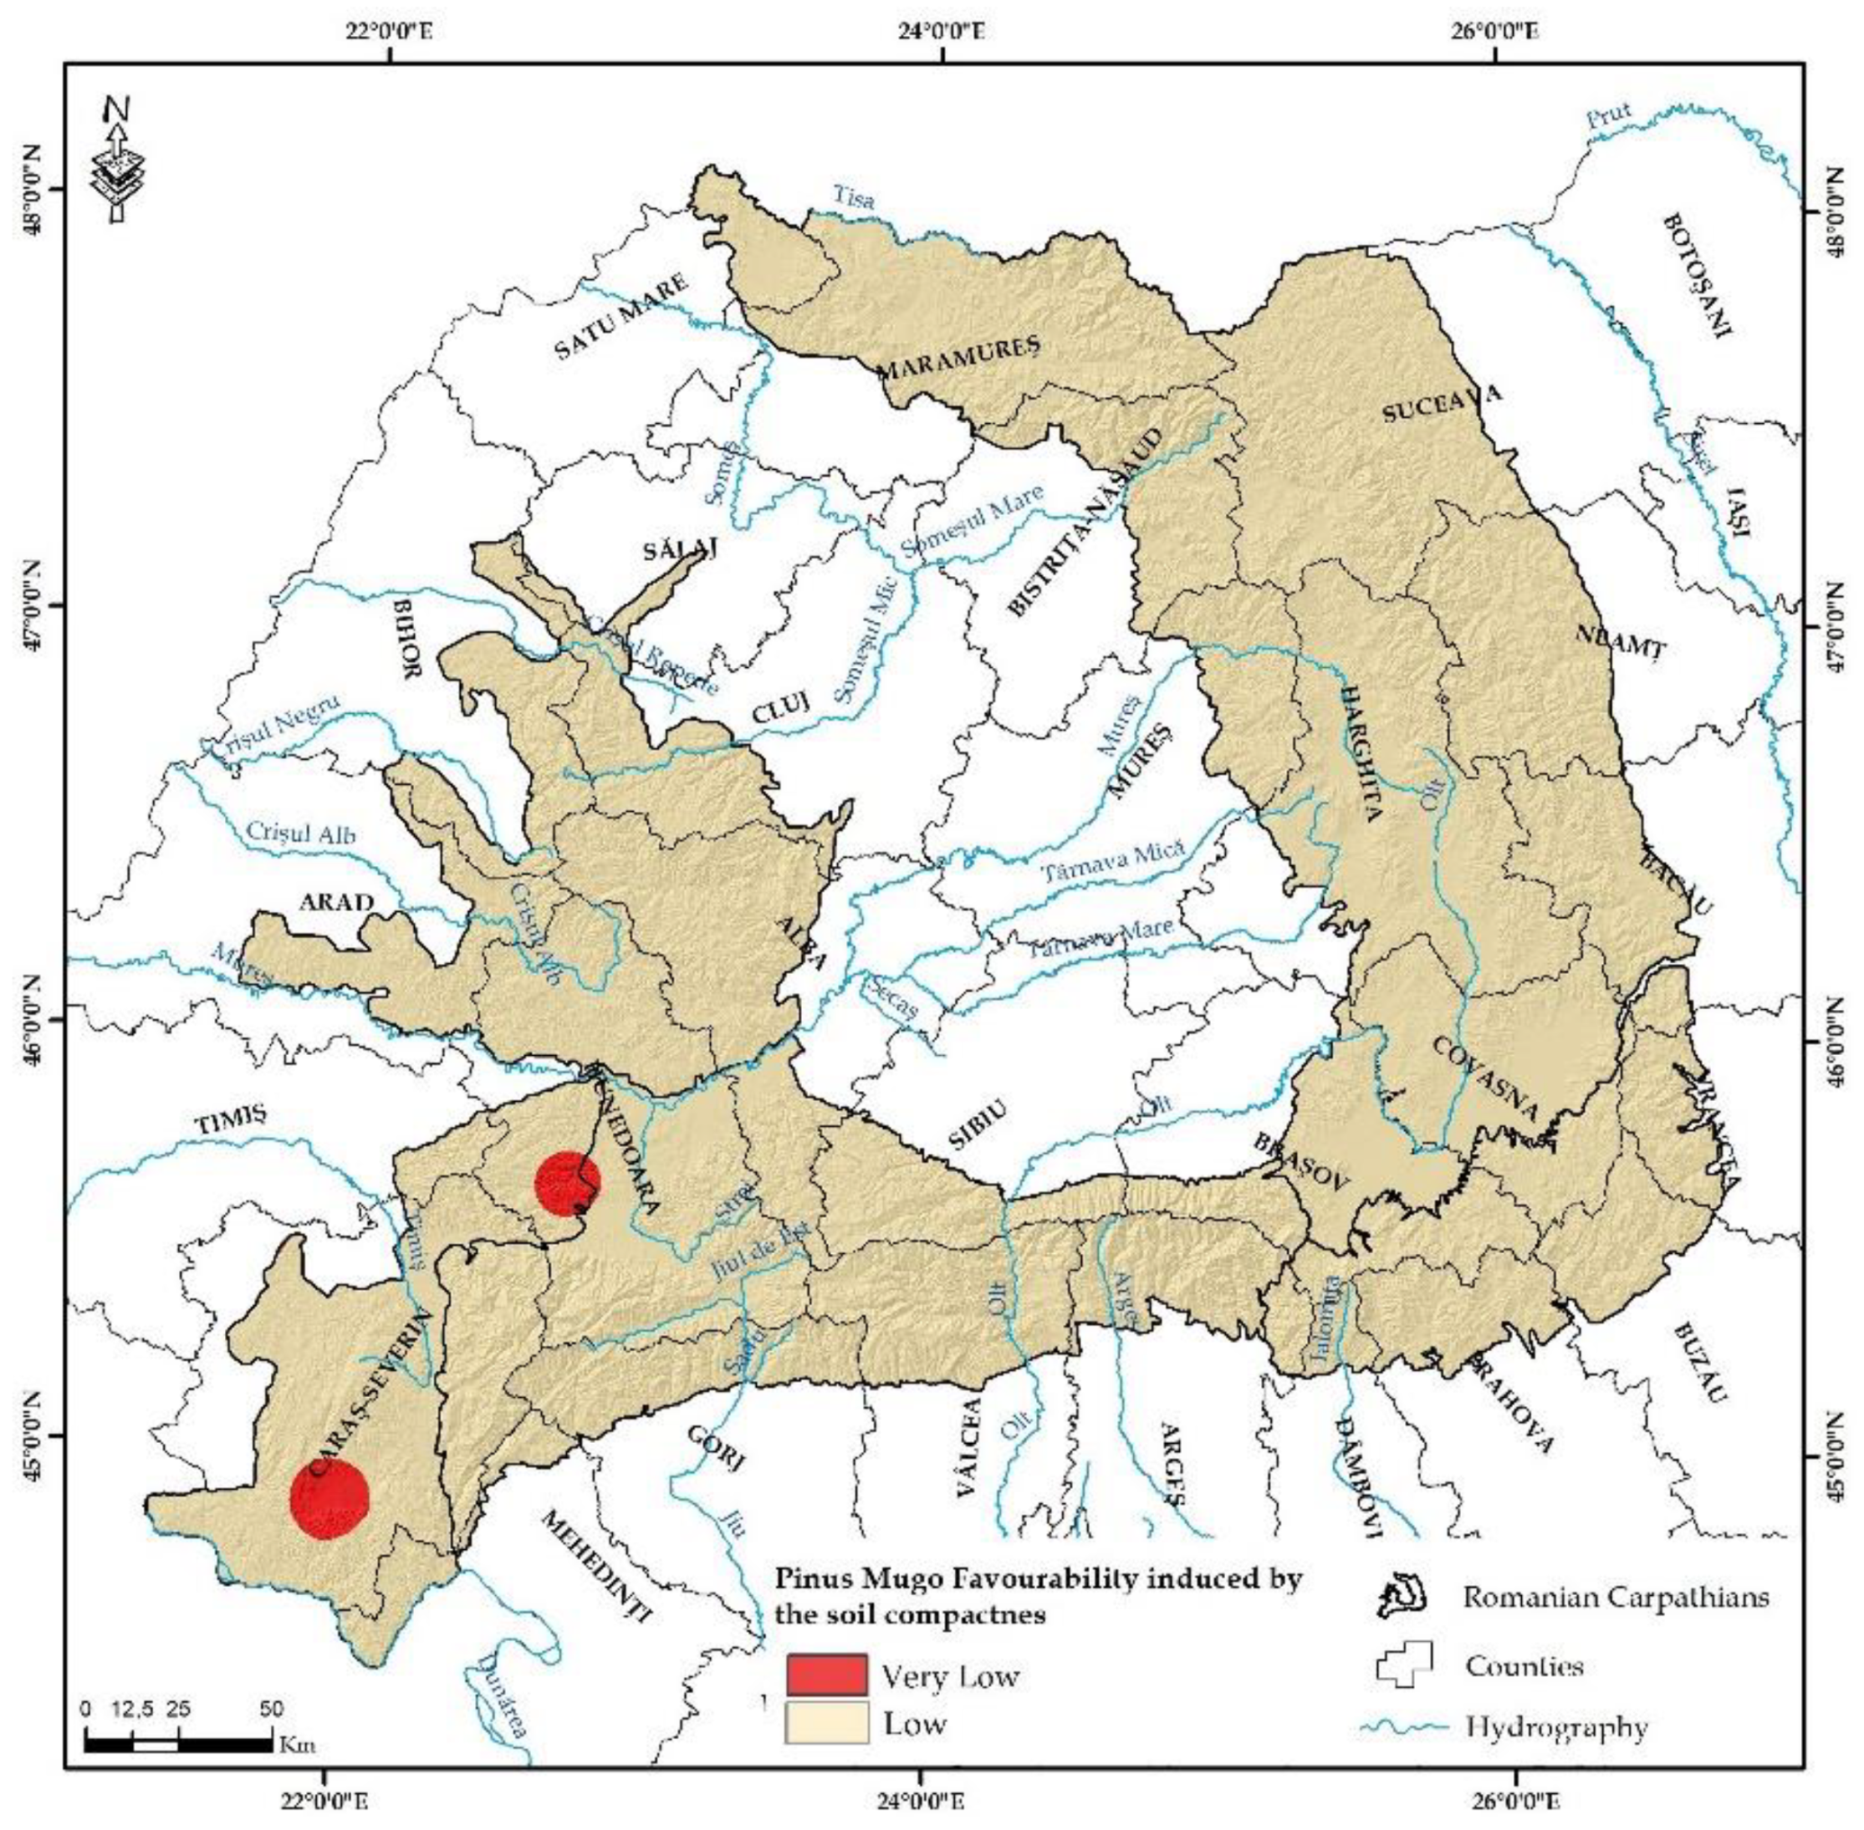
| 13. | Soil compactness | Very compact | Very loose, loose, moderatey loose, compact | All compactness classes |
| 14. | Soil texture | Loamy-clayey, Clayey-loamy, clayey | Sandy, sandy-loamy, Loamy-sandy, loamy | All texture classes |
| Nr. | Database | Database Type | Format | Source/Obtaining Process |
|---|---|---|---|---|
| 1 | Weather stations | primary | Vector (point) | Vectorisation |
| 2 | Average annual precipitation (mm) | modelled | Raster (GRID) 30 m | Implementation in GIS environment of the equation of the regression function Y = 0.435 X + 533.51, where: Y—average annual precipitation (mm) X—relative altitude (m) |
| 3 | Average annual temperature (°C) | modelled | Raster (GRID) 30 m | Implementation in GIS environment of the equation of the regression function Y = 0.395 X + 363.76, where: Y—average annual precipitation (mm) X—average annual temperature (degrees C) |
| 4 | Number of days with average temperature >10 °C | modelled | Raster (GRID) 30 m | Implementation in GIS environment of the equation of the regression function Y = 205.29 – 0.075 X, where: Y—average temperature >10 °C (days) X—altitude (m) |
| 5 | Relative atmospheric humidity in July (%) | derived | Raster (GRID) 30 m | Interpolation of punctual values from the weather stations |
| 6 | Wind regime | derived | Raster (GRID) 30 m | Interpolation of punctual values from the weather stations |
| 7 | Saturation degree of bases in soil (V%) | derived | Raster (GRID) 30 m | Interpolation of punctual values from the field |
| 8 | Soil acidity | derived | Raster (GRID) 30 m | Interpolation of punctual values from the field |
| 9 | Azote supply | derived | Raster (GRID) 30 m | Interpolation of punctual values from the field |
| 10 | Edaphic volume | derived | Raster (GRID) 30 m | Interpolation of punctual values from the field |
| 11 | Capacity of water supply | derived | Raster (GRID) 30 m | Interpolation of punctual values from the field |
| 12 | Soil compactness | derived | Raster (GRID) 30 m | Interpolation of punctual values from the field |
| 13 | Soil | primary | Vector (polygon) | Vectorisation |
| 14 | Soil texture | primary | Vector (polygon) | Vectorisation |
| 15 | Digital Elevation Model (DEM) | primary | Raster (GRID) 30 m | Direct acquisition |
| 16 | Slope exposure | derived | Raster (GRID) 30 m | Derived based on the DEM |
| Acquisition Date/ID | Mission | Band | |
|---|---|---|---|
| RED | NIR | ||
| 2018 12 X LC08_L1TP_184029_20181012_20181030_01_T1 | LANDSAT 8 OLI | Band 4 | Band 5 |
| 2013 5 X LC08_L1TP_185029_20131005_20170429_01_T1 | LANDSAT 8 OLI | Band 4 | Band 5 |
| 2008 15 X LE07_L1TP_185029_20081015_20161224_01_T1 | LANDSAT 7 ETM+ | Band 3 | Band 4 |
| 2003 31 VIII LE07_L1TP_185028_20030831_20170124_01_T1 | LANDSAT 7 ETM+ | Band 3 | Band 4 |
| 1998 28 X LT05_L1TP_185029_19981028_20180211_01_T1 | LANDSAT 5 TM | Band 3 | Band 4 |
| 1993 28 IX LT05_L1TP_185029_19930928_20170116_01_T1 | LANDSAT 5 TM | Band 3 | Band 4 |
| 1987 30 X LT05_L1TP_185029_19871030_20180211_01_T1 | LANDSAT 5 TM | Band 3 | Band 4 |
| Favourability Classes | Eastern Carpathian | Southern Carpathian | Western Carpathian | Area (km2) | Factors |
|---|---|---|---|---|---|
| % | |||||
| Very Low | 33,206 | 11,325 | 17,491 | 62,023 | Average annual temperature |
| 50.00 | 17.10 | 26.30 | 93.40 | ||
| Low | 1267 | 2870 | 221 | 4357 | |
| 1.90 | 4.30 | 0.3 | 6.60 | ||
| Very Low | 14,534 | 5385 | 13,261 | 33,180 | Average annual precipitation |
| 21.90 | 8.10 | 20.00 | 50.00 | ||
| Low | 19,939 | 8810 | 4450 | 33,200 | |
| 30.00 | 13.30 | 6.70 | 50.00 | ||
| Very Low | 26,669 | 8154 | 16,212 | 51,035 | Bioactive period |
| 40.20 | 12.30 | 24.40 | 76.90 | ||
| Low | 7804 | 6041 | 1500 | 15,345 | |
| 11.80 | 9.10 | 2.30 | 23.10 | ||
| Low | 2402 | 6264 | 13,345 | 22,011 | Relative atmospheric humidity |
| 3.60 | 9.40 | 20.1 | 33.20 | ||
| Medium | 51,381 | 15,885 | 14,285 | 81,551 | |
| 77.40 | 23.90 | 21.50 | 66.80 | ||
| Low | 34,348 | 14,040 | 17,683 | 66,071 | Wind regime |
| 51.70 | 21.20 | 26.60 | 99.50 | ||
| Very Low | 75 | 135 | 0 | 210 | |
| 0.10 | 0.20 | 0.00 | 0.30 | ||
| Very Low | 30,939 | 9756 | 17,001 | 57697 | Altitude |
| 46.6 | 14.7 | 25.6 | 86.90 | ||
| Low | 3534 | 4439 | 710 | 8683 | |
| 5.30 | 6.70 | 1.10 | 13.1 | ||
| Very Low | 2891 | 1089 | 1239 | 5220 | Aspect (Slope exposure) |
| 4.40 | 1.60 | 1.90 | 7.90 | ||
| Low | 31,582 | 13,106 | 16472 | 61,160 | |
| 47.60 | 19.70 | 24.80 | 92.10 | ||
| Very Low | 34,147 | 14,131 | 17378 | 65,656 | Degree of soil saturation with bases |
| 51.40 | 21.30 | 26.20 | 98.90 | ||
| Low | 276 | 44 | 305 | 624 | |
| 0.40 | 0.1 | 0.50 | 0.90 | ||
| Very Low | 28,527 | 11,287 | 15,666 | 55,480 | Soil acidity |
| 43.00 | 17.0 | 23.60 | 83.60 | ||
| Low | 5895 | 2888 | 2017 | 10,801 | |
| 8.90 | 4.40 | 3.00 | 16.30 | ||
| Very Low | 1790 | 0 | 127 | 1917 | Azote from soil |
| 2.70 | 0.00 | 0.20 | 2.90 | ||
| Low | 32,632 | 14,175 | 17,556 | 64,364 | |
| 49.20 | 21.40 | 26.40 | 97.00 | ||
| Very Low | 28,467 | 13,970 | 17,377 | 59,814 | Edaphic volume |
| 42.90 | 21.00 | 26.20 | 90.10 | ||
| Low | 5956 | 205 | 306 | 6467 | |
| 9.00 | 0.30 | 0.50 | 9.70 | ||
| Very Low | 3189 | 1010 | 1743 | 5942 | Usable soil water |
| 4.80 | 1.50 | 2.60 | 9.00 | ||
| Low | 31,233 | 13,166 | 15,940 | 60,339 | |
| 47.10 | 19.80 | 24.00 | 90.90 | ||
| Very Low | 0 | 42 | 576 | 618 | Soil compactness |
| 0.00 | 0.10 | 0.90 | 0.90 | ||
| Low | 34,425 | 14,133 | 17,109 | 65,667 | |
| 51.90 | 21.30 | 25.80 | 98.90 | ||
| Very Low | 3306 | 857 | 2191 | 6354 | Soil texture |
| 5.00 | 1.30 | 3.30 | 9.60 | ||
| Low | 31,110 | 13,319 | 15,494 | 59,922 | |
| 46.90 | 20.10 | 23.30 | 90.30 |
© 2019 by the authors. Licensee MDPI, Basel, Switzerland. This article is an open access article distributed under the terms and conditions of the Creative Commons Attribution (CC BY) license (http://creativecommons.org/licenses/by/4.0/).
Share and Cite
Roșca, S.; Șimonca, V.; Bilașco, Ș.; Vescan, I.; Fodorean, I.; Petrea, D. The Assessment of Favourability and Spatio-Temporal Dynamics of Pinus Mugo in the Romanian Carpathians Using GIS Technology and Landsat Images. Sustainability 2019, 11, 3678. https://doi.org/10.3390/su11133678
Roșca S, Șimonca V, Bilașco Ș, Vescan I, Fodorean I, Petrea D. The Assessment of Favourability and Spatio-Temporal Dynamics of Pinus Mugo in the Romanian Carpathians Using GIS Technology and Landsat Images. Sustainability. 2019; 11(13):3678. https://doi.org/10.3390/su11133678
Chicago/Turabian StyleRoșca, Sanda, Vasile Șimonca, Ștefan Bilașco, Iuliu Vescan, Ioan Fodorean, and Dănuț Petrea. 2019. "The Assessment of Favourability and Spatio-Temporal Dynamics of Pinus Mugo in the Romanian Carpathians Using GIS Technology and Landsat Images" Sustainability 11, no. 13: 3678. https://doi.org/10.3390/su11133678