
Machine Learning-Based Prediction of Dynamic Responses of a Tower Crane under Strong Coastal Winds

1
School of Civil Engineering and Architecture, NingboTech University, Ningbo 315100, China
2
Ningbo Research Institute, Zhejiang University, Ningbo 315100, China
3
School of Mechanics and Civil Engineering, China University of Mining and Technology, Xuzhou 221116, China
4
Institute of Structural Engineering, Zhejiang University, Hangzhou 310058, China
5
China E-Tech (Ningbo) Maritime Electronics Research Institute Co., Ltd., Ningbo 315100, China
*
Authors to whom correspondence should be addressed.
J. Mar. Sci. Eng. 2023, 11(4), 803; https://doi.org/10.3390/jmse11040803
Submission received: 23 February 2023
/
Revised: 28 March 2023
/
Accepted: 7 April 2023
/
Published: 10 April 2023
(This article belongs to the Section Coastal Engineering)
Abstract
:With the rapid development of the construction industry, tower cranes are increasingly used in coastal engineering. However, due to the complexity of their operating environment, tower cranes are vulnerable to typhoons, thunderstorms, and other extreme natural disasters. Therefore, it is becoming increasingly important to carry out safety warnings for the tower crane structure under the action of strong winds. In this paper, a real-time monitoring system for tower responses based on the Internet of things (IoT), which realizes long-term monitoring of the whole process of tower crane operation, was built. Based on the long-term monitoring data and the machine learning algorithm, two tower response prediction models were established. During the transit of super typhoon In-fa, the maximum displacement of the tower structure was predicted in advance, based on the measured wind speed data at the site, which is in good agreement with the displacement data monitored by the IoT. The results show that under strong winds, the non-working tower has a response lag, resulting in the fact that its maximum displacement does not correspond to the maximum wind speed moment at the site. This is mainly due to the weathercock effect of the tower in the non-working condition. The prediction model proposed in this paper can provide timely and effective safety warnings for the tower structure. It also can provide useful engineering references and scientific structural safety warning suggestions for the same type of tower cranes that do not have IoT monitoring systems installed.
1. Introduction
With the rapid development of the construction industry, tower cranes are increasingly used in coastal engineering. However, due to the complexity of their operating environment, tower cranes are vulnerable to typhoons, thunderstorms, and other extreme natural disasters. The wind safety of tower cranes in complex wind environments has been a key issue for engineers and technicians. In China, structural damage to tower cranes caused by typhoons occurs every year, posing a major safety hazard in the construction process; thus, attention should be paid to the wind safety management of these large machines.
However, the response of tower cranes to extreme wind loads has not been studied extensively, and the existing research on the wind dynamic response of tower cranes is not significant [1,2,3]. Lee et al. [4] examined the effect on the structural stability of tower cranes by changing the shape of the tower crane bars in a wind tunnel test. Han et al. [5] compared the force results of each support point of a tower crane through a wind tunnel test. Klinger [6] carried out an analytical study of the vibration effects of different tower crane models using wind tunnel tests. Jerzy et al. [7] investigated issues such as the operation and positioning of tower cranes when exposed to different levels of wind penetration by installing automatic monitoring devices on tower cranes. In China, wind loads are treated as static loads in tower crane design, and the effect of pulsating wind is ignored. In practice, however, natural wind is actually a random pulsating load that can cause the structure to vibrate, so the effect of pulsating wind must be taken into account. With the development of the construction industry, the demand for tower cranes is gradually moving towards a lighter weight and a larger span, so the vibration analysis [8,9,10,11,12] of tower cranes under wind loads, as well as vibration control research [13,14,15,16], must be considered. Wang [17] used ANSYS Workbench to construct a mechanical model of a portal tower crane and used the linear filter method to simulate the pulsating wind speed and wind pressure time histories, which were applied to the model for force analysis, and finally found that the pulsating wind loads produced larger stresses and displacements than those produced by static wind loads. Lu et al. [18] proposed some specific CFD (computational fluid dynamics) modeling and simulation procedures to address the spatiotemporal characteristics of buildings under construction and the various working conditions of tower cranes. Jiang et al. [19] constructed a digital twin framework of human–machine interaction construction activities based on the scaled model to simulate various hoisting behaviors as realistically as possible and to analyze their dynamic effects on the tower crane. The stability change law of the tower crane with the incremental dynamic load was obtained based on the collapse probability level function. In summary, most of the above research works on the wind-induced dynamic response of tower cranes are based on wind tunnel model tests or numerical simulations, and there is a lack of long-term field measurement work for verification and calibration.
In addition, there is little current research on the dynamic responses of tower cranes during typhoon strikes. It is essential to evaluate the performance of tower cranes against typhoons. However, at present, China’s load code (GB50009-2012) [20] has not yet made clear provisions for the typhoon wind field, due to the fact that the current typhoon wind speed data measured near the ground is not sufficient to make an accurate calibration of typhoon weather patterns. Therefore, researchers generally rely on statistical dynamic models to evaluate the tropical cyclone wind hazards around the world. The development and utilization of the typhoon/hurricane full-track simulations for the Atlantic Ocean [21,22,23,24,25,26,27] and the Northwest Pacific Ocean [28,29,30,31] have been considered and expanded in the past two decades. Today, some novel typhoon intensity models [32,33], considering environment variables that can be obtained from reanalysis or global climate models, have the potential to estimate the future wind hazards under future climate projections.
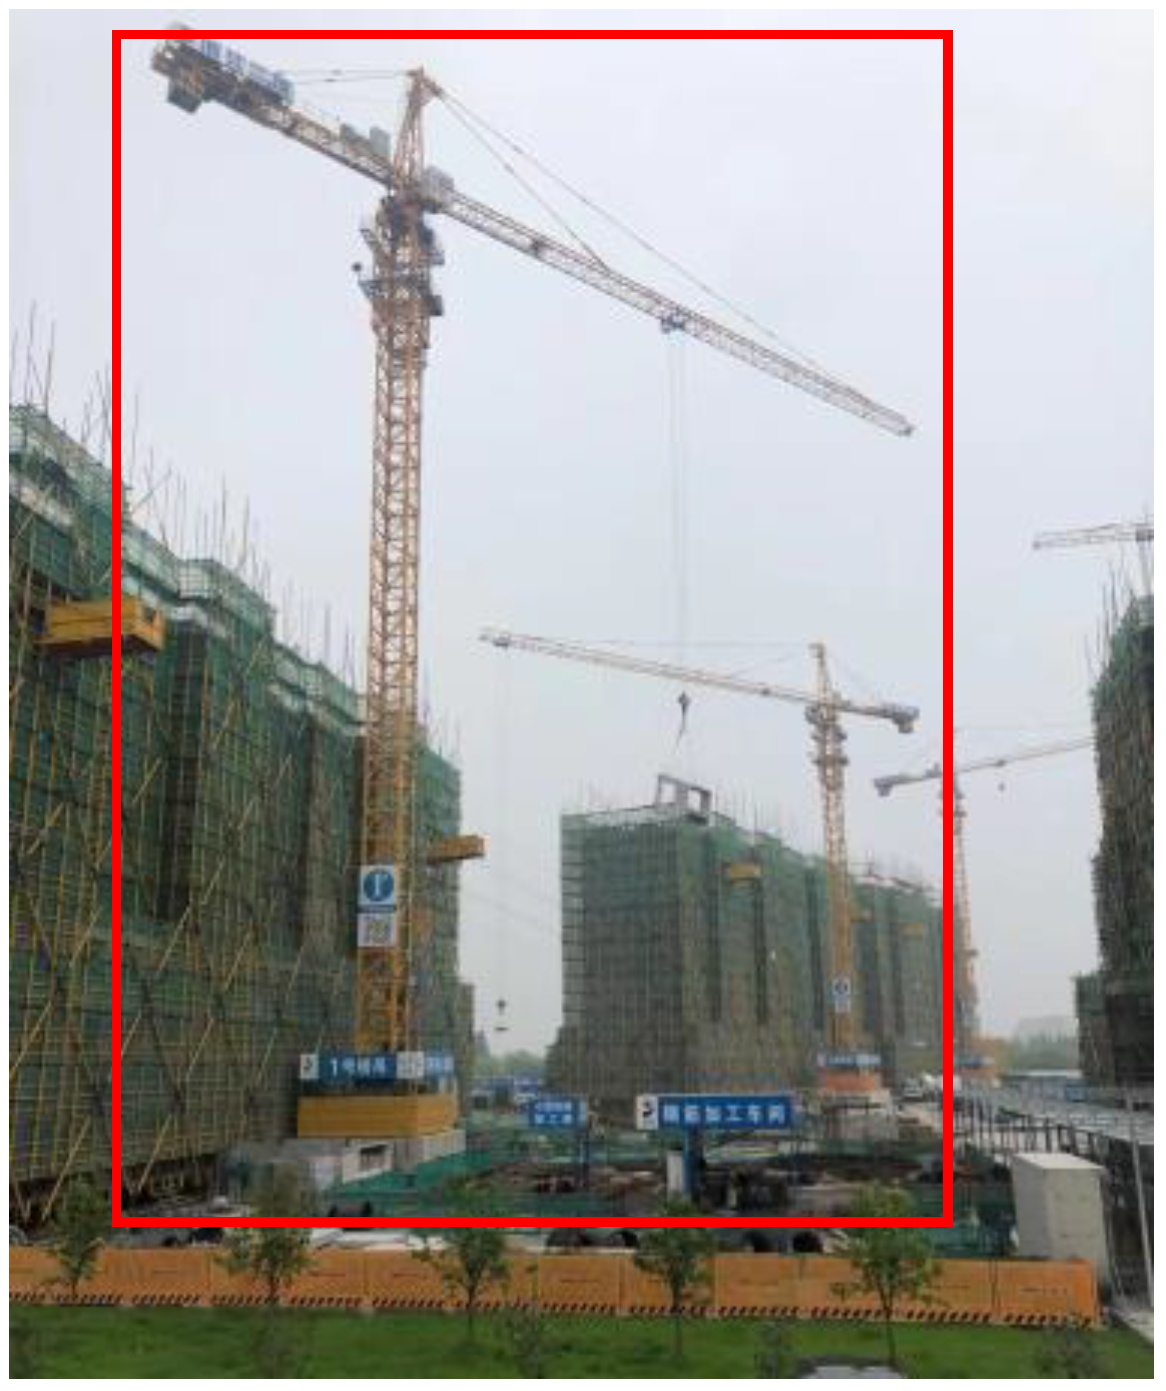
The main objective of this paper is to make up for the lack of current research on the dynamic response of the tower crane under typhoon and the lack of research on the structural response of the tower crane based on field measurements. In this paper, an upper slewing tower crane (as shown in Figure 1) in Ningbo, China, was used as the research object, and a real-time monitoring system of tower crane structural response based on the Internet of things (IoT) was built to realize the long-term monitoring of the whole process of tower crane operation. Based on the long-term monitoring data and the machine learning algorithm, a tower displacement response prediction model was established. During the passage of super typhoon In-Fa, based on the measured wind speed data, the maximum displacement of the tower along the height was predicted in advance, which is in good agreement with the displacement data monitored by the IoT.
2. IoT-Based Tower Crane Monitoring System Construction
2.1. Monitoring Equipment
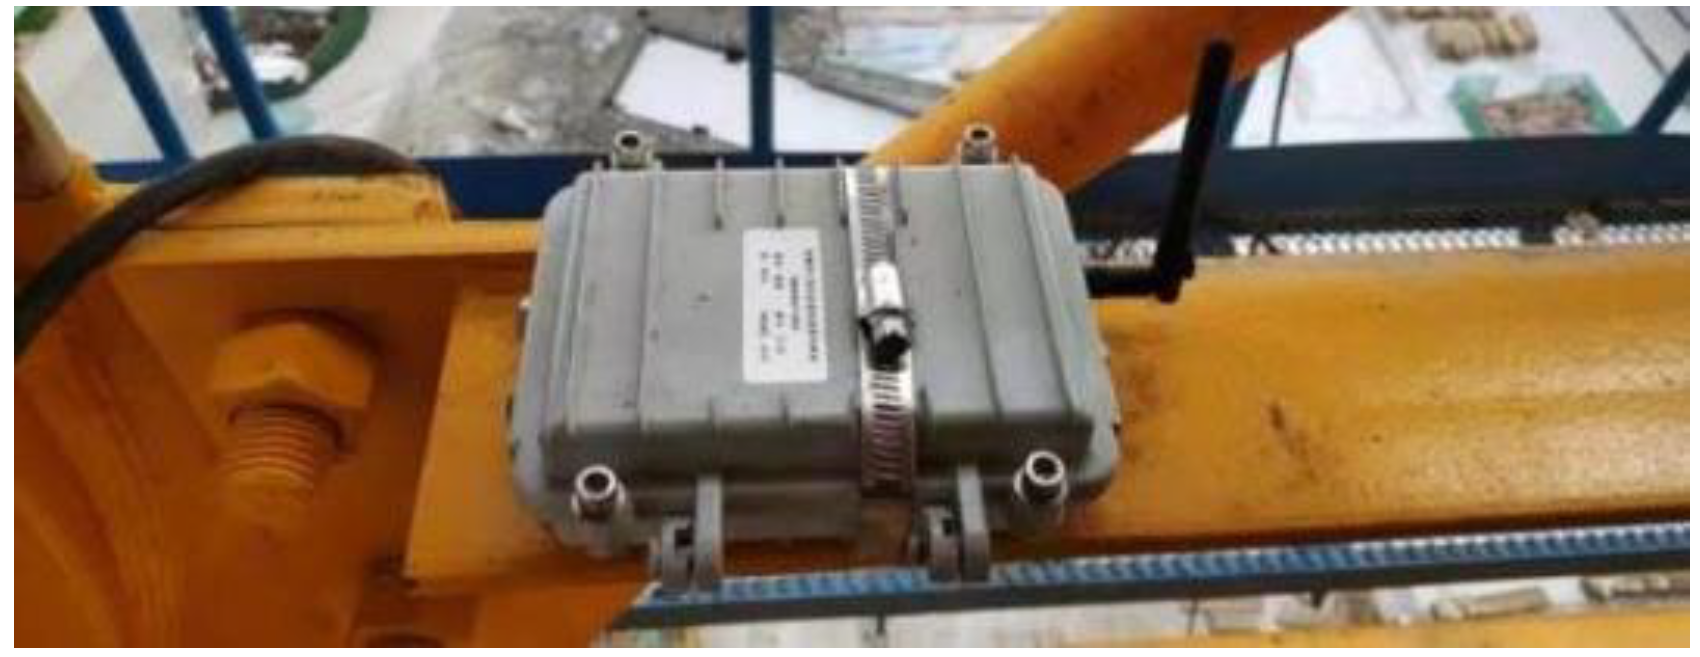
As shown in Figure 2, in order to monitor the structural response status of the tower in real time, this paper selected the inclination sensor; with a real-time data upload function, the instrument can calculate the offset of the tower according to the change of the corresponding tilt angle of the three axes. The sensor measures the tilt angles of the X, Y, and Z axes and uploads data for the average, maximum, and minimum values of the three axis tilt angles, with a range of ±90°, a sensitivity of 0.001°, and a maximum error of 0.01°, enabling long-term monitoring in harsh environments.
In addition, an ultrasonic anemometer with memory and real-time monitoring capabilities was selected to monitor the wind speed and direction at the site. The monitoring equipment is shown in Figure 3, with a sampling frequency of 4 Hz. The instrument can automatically record the changes in wind speed and direction at the site in real time and send the data to the terminal via the gateway.
2.2. Monitoring Program
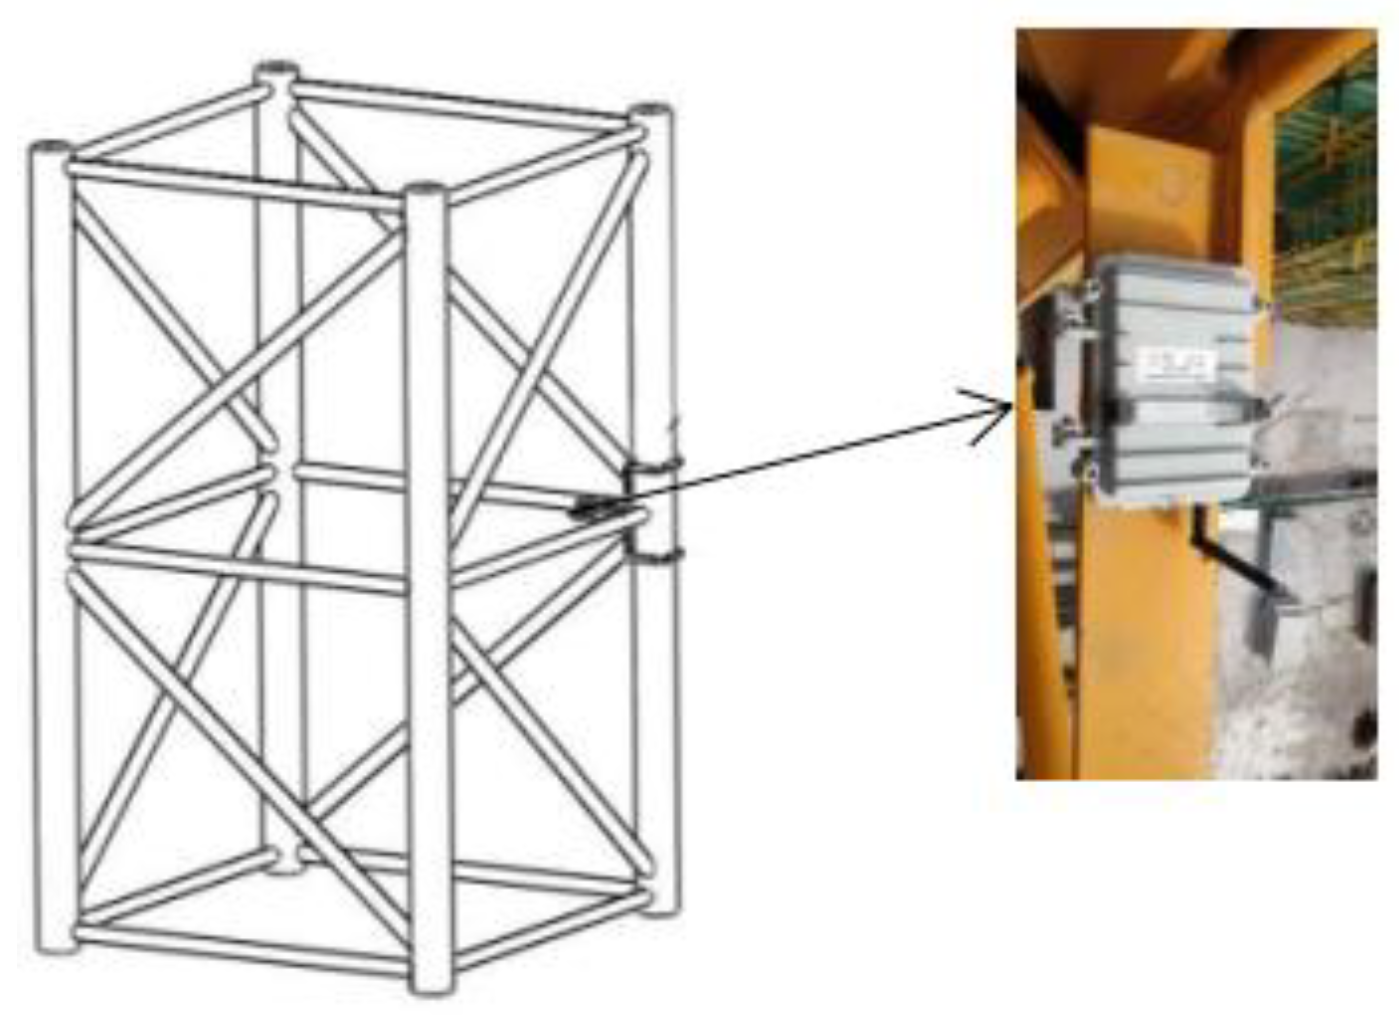
In order to specifically analyze the displacement of each section of the tower, the sensors were positioned (the adjacent distances are shown in Figure 4), and the instruments were fixed using rings. In Figure 4, Nos. 1610–1616 are the inclination sensors, where Nos. 1610–1615 were positioned in the standard section shown in Figure 5, and No. 1616 was fixed to the top of the tower. In addition, an ultrasonic anemometer was installed near the tower to monitor the wind speed and direction at the site (Figure 6). In summary, the tower monitoring system consists of seven inclination sensors, a small weather station, and a wireless gateway.
2.3. IoT Monitoring Cloud Platform Construction
Figure 7 shows the topology of the tower crane IoT system built in this study. A complete wireless sensor network should include a perceptual layer for data collection, a transport layer for data transmission, and an application layer for data processing and display. In this paper, the tower crane monitoring system has been similarly divided into three layers. The perceptual layer consists of inclination sensors and anemometers, which are used to collect data such as the crane’s own tilt and the site wind speed when it is in operation; the transport layer is mainly a GPRS network, which is used to realize wireless data transmission; and the application layer consists of a remote monitoring cloud platform, which is used to display real-time data. In order to realize intelligent management of the tower crane, a set of cloud platforms for remote monitoring of the working status of a tower crane has been developed, based on the above hardware. The cloud platform contains storage and download functions, which can not only ensure data security, but also realize real-time monitoring and the early warning of the tower crane.
3. Long-Term Monitoring Data Analysis
Before the arrival of super typhoon In-Fa, the long-term monitoring of the tower crane in this paper covered the period from 1 January 2020 to 22 July 2021. Taking each natural day as a period for monitoring the tower crane, a total of 569 working periods can be obtained. A site employee was assigned to record the working status of the tower crane on a daily basis. The working status of the tower crane from 8:00 to 16:30 on 14 April 2021 is shown in Figure 8a, where “1” indicates that the tower crane is in the lifting state, and “0” indicates that the tower crane is in the idle state. Taking the idle state of the tower crane at 8:00 on 14 April as the initial state and the state at 17:00, i.e., 30 min after the tower crane stopped working, as the final state, the offset of each section of the tower crane can be obtained, and the results are shown in Figure 8b. It can be seen that the offset of each measurement point increases with height during the lifting process, and the maximum displacement of the tower tip section (i.e., No. 1616) reaches 457 mm, and the maximum displacement of the tower body (i.e., No. 1615) reaches 407 mm during the working process. Two sections were affected by the crane work and changed with the lifting and unloading of the tower crane, which is basically the same as the working condition records in Figure 8a. The differences are shown in the red dashed box section and the blue dashed box section in Figure 8b. Although the red box section recorded that the tower crane was idle, the overall offset of the tower crane was large. According to the relevant guidelines in China’s Regulations for the Operation of Tower Cranes (JG/T 100-1999) [34], the tower crane should be idle before lifting. Therefore, although the crane was not in lifting mode for the first 1 h in the work log, the movements of the hook and trolley during this period will cause the offset to increase. The blue box in the figure shows that the tower crane was out of operation, but the displacement of each section of the tower in the figure was still present. Combined with the wind speed measured at that time, it is known that there was a gust of 5.08 m/s at the site at 11:30. Therefore, the tower crane sections were also deflected under the strong wind load. It should be added that since there is a certain distance between the installation position of each sensor and the center axis of the tower crane in this project, if there is a slight twisting situation of the tower crane, it will affect the measurement value of the two horizontal axes, as well as the tilt, which will cause measurement errors.
In order to observe the verticality of the tower crane after working, the tower crane under no load at 17:00 on 14 April 2021 (after the tower crane stopped working for 30 min) was used as the final state, and the offset of each measurement point is shown in Table 1. As can be seen from the table, the maximum displacement of the tower crane was 66.3 mm, which was much smaller than the requirement of 244 mm of the maximum permissible displacement in the Chinese Technical Regulations for Safety in the Use of Construction Machinery (JGJ33-2012) [35], and the tower crane was in a safe state.
4. Machine Learning-Based Prediction Methods
4.1. RBF Neural Network Fundamentals
Since the 1980s, machine learning has attracted widespread attention as a way to achieve artificial intelligence, and especially in the last decade, research on machine learning has developed rapidly and has become one of the major topics in artificial intelligence. Machine learning has been applied not only to knowledge-based systems, but also to natural language understanding, non-monotonic reasoning, machine vision, pattern recognition, and many other areas. The main research directions in machine learning include research on decision trees, random forests, artificial neural networks, Bayesian learning, and so on. Among them, the RBF (radical basis function) neural network, as an efficient feed-forward network, has the best approximate performance and global optimum characteristics not possessed by other feed-forward networks, and exhibits a simple structure and a fast training speed. The network topology consists of an input layer, a radial basis function hidden layer, and an output layer. Its main advantage is that it can approximate and predict any continuous nonlinear function in any accuracy range, with global approximation capability [36]. Its topology is compact and the structural parameters can be learned individually. In addition, the generalization capability of RBF networks is superior to that of the more widely used BP networks in several respects. In RBF neural networks, the input data does not need to be transformed when it enters the input layer. When the data enters the hidden layer, the neural nodes in the hidden layer perform a kind of spatially non-linear mapping transformation on the data via basis functions. The output layer uses a linear operation strategy, so learning is faster. Finally, the mapped values are output by a linearly weighted combination of the output layer neural nodes [37].
The input layer of the RBF neural network realizes the spatial nonlinear mapping transformation through a radial basis function, in which the commonly used basis functions are Gaussian functions with the following activation functions [36]:
where is the Euclidean norm; is the pth input data; ci is the implicit layer node center; and σ is the variance of the basis function.
The output layer of the RBF neural network is linearly mapped by weighted combinations, which can be expressed as [36]:
where is the connection weight from the hidden layer to the output layer; , h is the number of nodes in the hidden layer; and is the jth actual output value corresponding to the data.
4.2. BP Neural Network Fundamentals
The BP (back propagation) neural network is a multi-layer feed-forward network trained by the error back-propagation algorithm and is one of the most widely used neural network models. The standard BP network structure generally consists of three neural layers: the input layer, the hidden layer, and the output layer. The neurons in each layer form a complete interactive connection, and the neurons in each layer are independent of each other. Based on the error between the real value and the output value, the BP neural network algorithm adjusts the weight and threshold in the reverse direction, and finally achieves the minimum mean square error. As the learning speed of the BP neural network is fixed, the convergence speed of the network is slow, and it requires a long training time. In this paper, the training result of the BP model was compared with that of the RBF neural network model.
4.3. Construction of Tower Displacement Response Prediction Model
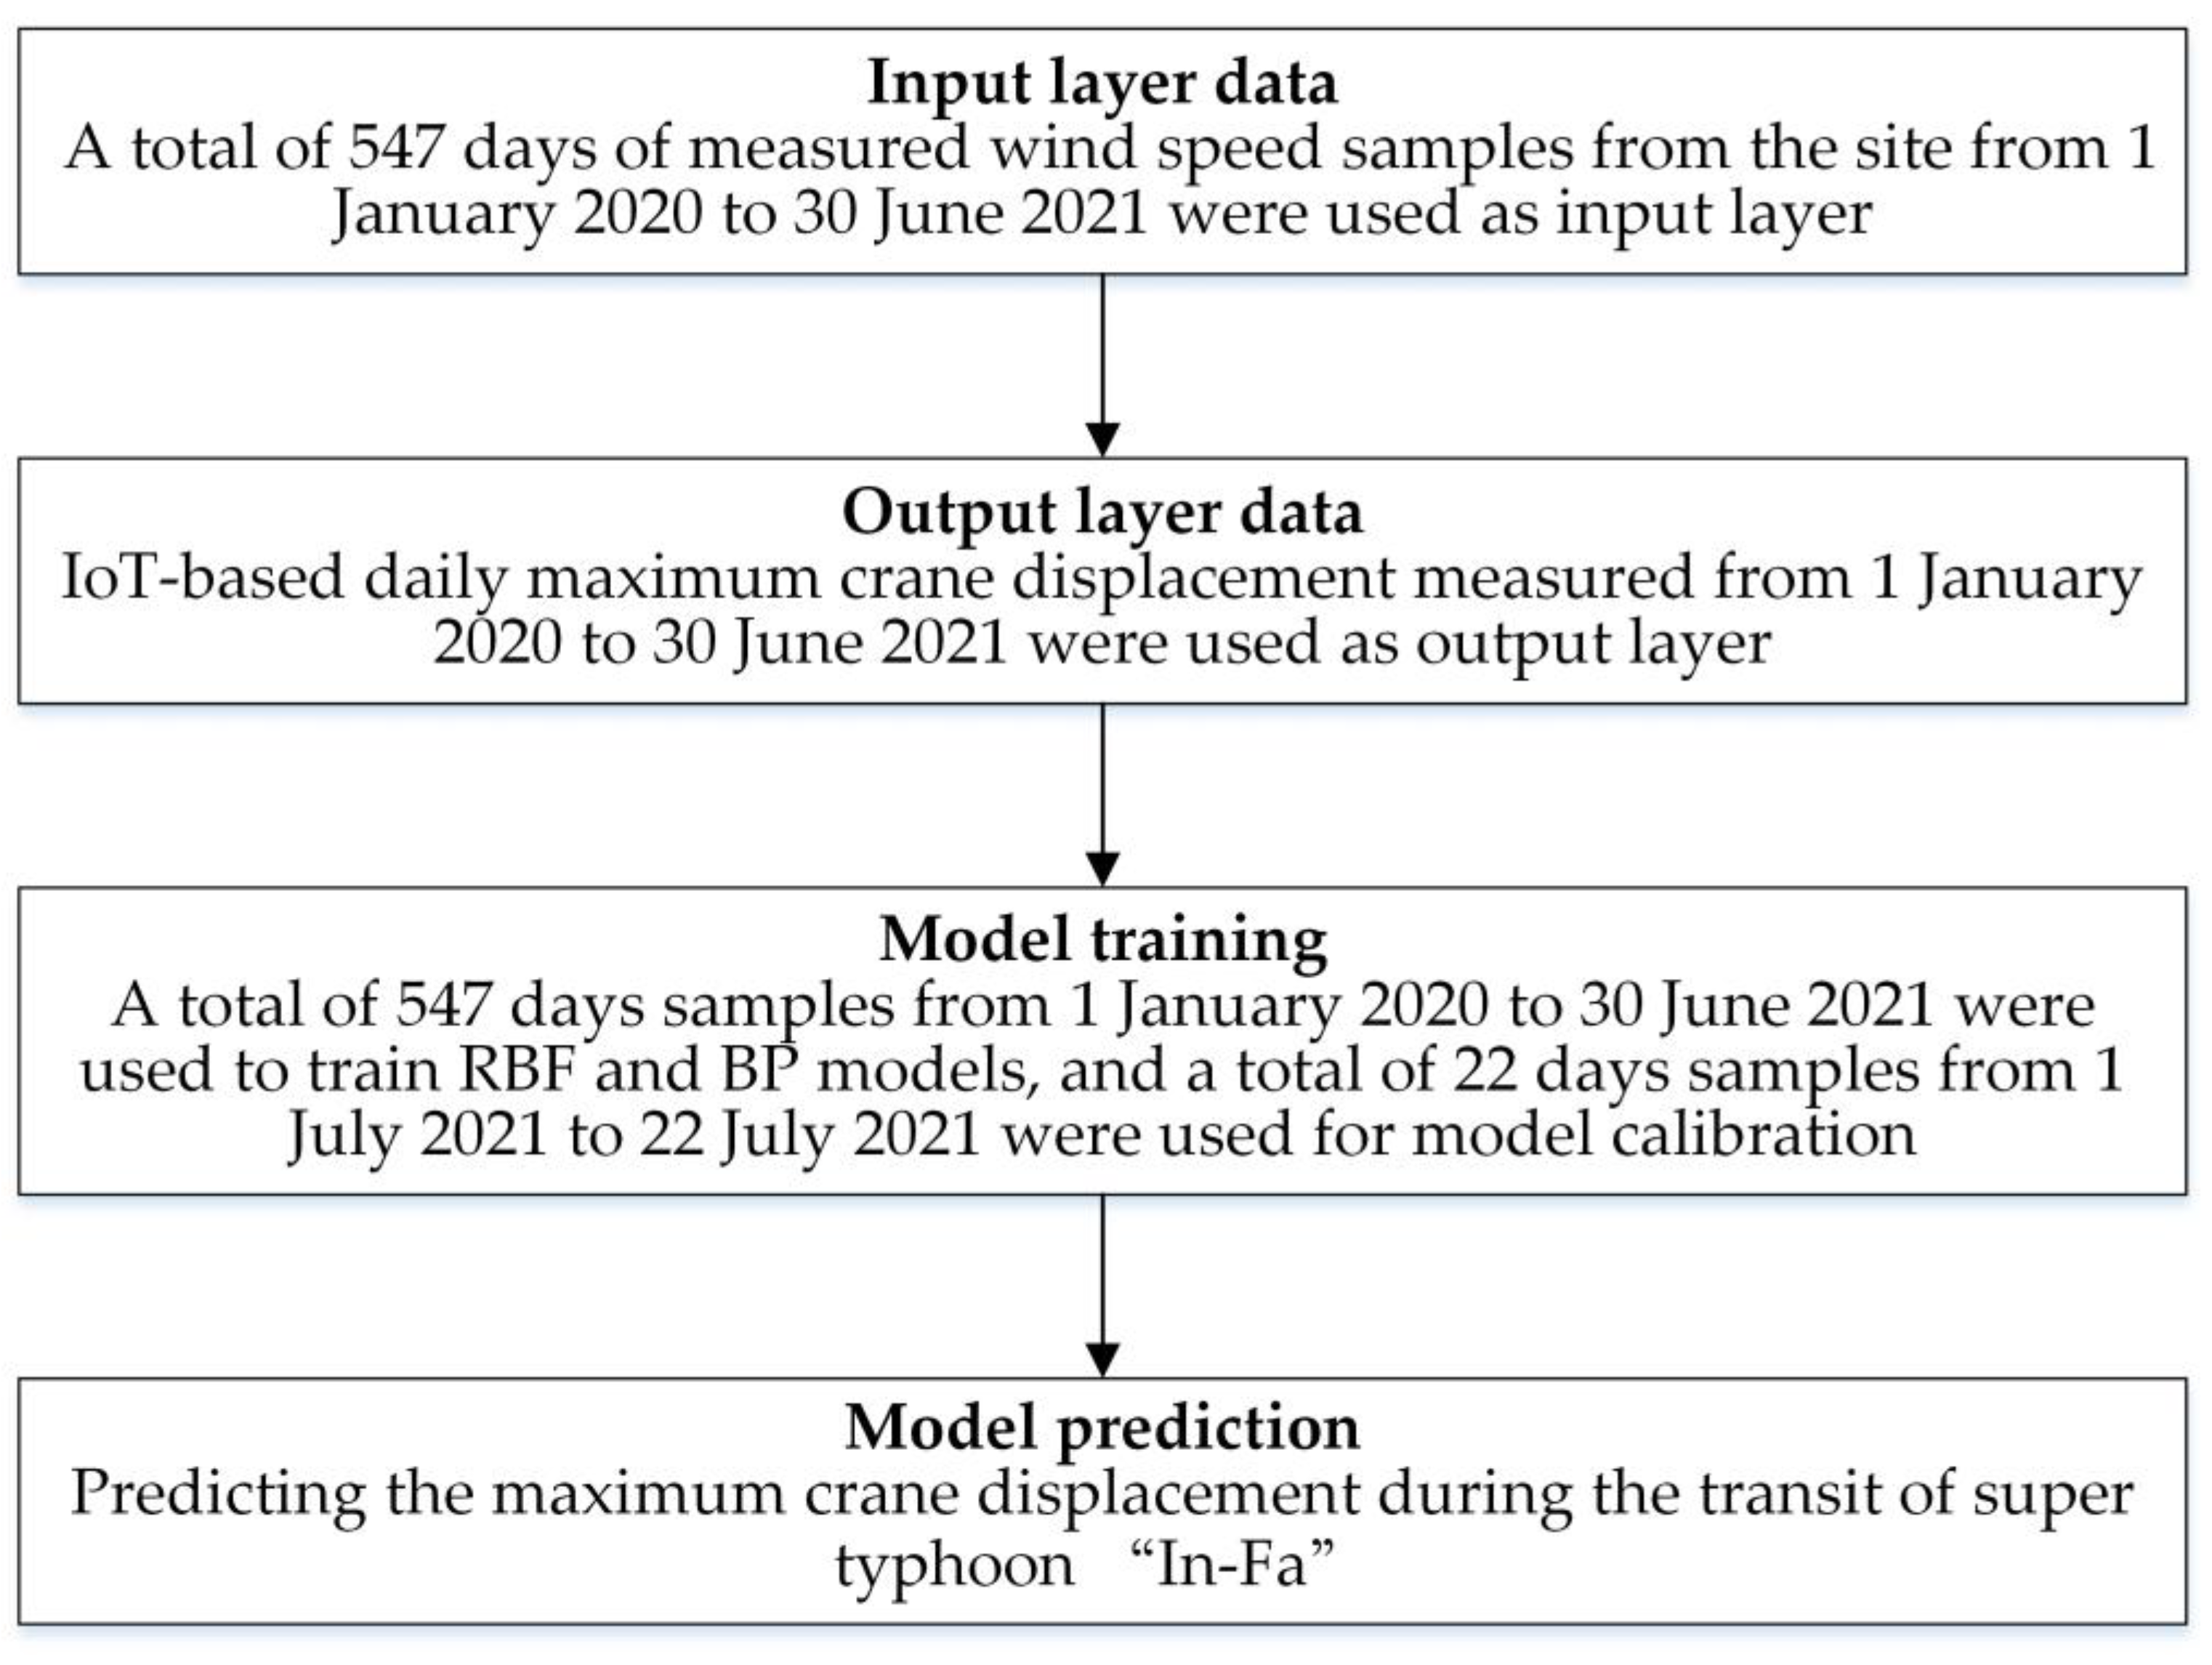
The construction procedure of the tower crane displacement response prediction model is shown in Figure 9. As can be seen, a total of 547 days of measured wind speed samples from the site (Ningbo, China) from 1 January 2020 to 30 June 2021 were selected as the input layer data, and the IoT-based daily maximum tower displacement measured during the same period was selected as the output layer data. Then, the prediction models based on RBF and BP neural networks were established through model training and calibration, respectively. It should be noted that the construction of the RBF neural network was simpler than that of the BP neural network. Based on the existing samples, a neural network with a radial basis function expansion factor of 1.2 was constructed, and the target mean square error was set to 0.001. The training algorithm of the RBF neural network was divided into two steps: the first step was to determine the number of hidden layers and the central ci of the basis function according to the distribution of the training samples; the second step was to determine the connection weight according to the determined network parameters. The BP neural network was designed as a typical three-layer network model. The training number was set to 1000, the error training objective was also set to 0.001, and the other parameters were used as default values.
4.4. Model Training for Tower Crane Response Prediction
The monitoring samples for the first 547 work periods (i.e., 1 January 2020 to 30 June 2021) were selected to train the RBF and BP neural network models, and the samples of the last 22 work periods (i.e., 1–22 July 2021) were used for model verification. The predictions of the BP model were used for comparison. The extensive monitoring samples covered all extreme wind events affecting the site during the monitoring period, including typhoons, downburst storms, gusts, squall line winds, and the East Asian monsoon. It is worth noting that during the training process of the RBF neural network, the number of hidden layer nodes can be automatically increased until the maximum number of hidden layer nodes or the accuracy requirement is reached. In the training process of the BP neural network, in order to make the output result closer to the training target, long manual debugging is required for the number of hidden layer nodes, the training function, and other relevant parameters in the model. The error convergence curves of the two types of neural network models after training are shown in Figure 10. It can be seen from the figure that when the training error accuracy is set to 0.001, both models converge under the given conditions. The BP neural network model requires 110 steps to achieve the accuracy requirement, while the RBF neural network model requires only 11 steps to achieve the same accuracy requirement, and its training speed is significantly better than that of the BP model. The above analysis shows that the RBF neural network has an advantage over the BP neural network in terms of training speed.
In order to calibrate the above two models, the predicted value of the BP and RBF neural network model was compared with the actual value (i.e., the daily maximum displacement response of the tower crane based on the IoT), and the mean square error was used as the evaluation index. The comparison result is shown in Figure 11. A total of 22 days were numbered sequentially. With the approach of super typhoon In-Fa, the wind speed at the site increased, and the model prediction errors all increased accordingly. It is worth noting that the maximum error of the BP model is 7.3 × 102 mm2 (occurred on 22 July 2021), which is larger than that of the RBF model, with a maximum error of 4.8 × 102 mm2 which occurred on the same day, and which fluctuates widely in the error range.
5. Prediction of Typhoon-Induced Dynamic Responses of the Tower Crane
The wind field simulation of super typhoon In-Fa was carried out by the mesoscale numerical meteorological model WRF (weather research and forecasting) [38,39,40,41], as shown in Figure 12a. The construction site is located to the southwest of the center of the typhoon, and it can be seen that the construction site was expected to be affected by strong winds from the north when the typhoon made landfall. Based on the wind speed and direction data obtained from the ultrasonic anemometer, the data were categorized according to 16 wind directions, and a wind rose diagram was drawn. Figure 12b shows the 10 min average wind speed and corresponding wind direction at the construction site during the duration of typhoon In-Fa (i.e., 18 July to 30 July 2021). It can be seen from the figure that the site was indeed affected by strong winds from the north during the typhoon impact period, which is consistent with the simulation results.
The measured typhoon wind speed at the site from 8:00 on 24 July to 20:00 on 26 July 2021 is shown in Figure 13. It can be seen that the wind speed at the site has been increasing since 14:00 on 24 July, and the 10 min average wind speed reached the maximum value (28.56 m/s) at 7:20 on 25 July, and the 3 s gust wind speed reached the maximum value (40.86 m/s) at 7:40, while the 3 s gust wind speed quickly decreased to 4.59 m/s at 22:00 on the same day, indicating that the site entered the typhoon eye area. According to relevant reports, the diameter of the eye reached 100 km when In-Fa made landfall, and the distance from the center of the typhoon to the site in this study was only about 35 km, so the typhoon wind speed observed at the site changed sharply in a short time.
Figure 14 shows the actual tower displacement measured by the IoT system during the same monitoring period. It can be seen that the actual maximum offset of the tower was 648.73 mm, which occurred at 9:00 am on 25 July, a delay of more than 1 h compared to the moment when the maximum wind speed occurred at the site. The maximum displacement of the tower measured at the time of the maximum 3 s gust wind speed (7:40) was only 200.44 mm, indicating that there was a hysteresis phenomenon in the displacement response of the tower. This is mainly due to the weathercock effect of the tower in the non-operational state; that is, when the upper structure of the tower is at a certain angle to the wind load direction, the tower slewing mechanism will rotate around the tower axis, and the continuous change of the windward area of the tower will cause the load response lag; when it slews to parallel with the wind load direction and is stable and no longer slews, the windward area is minimal and its displacement will gradually become smaller. The actual measured displacement response lag of the tower, shown in Figure 14, can effectively verify the above explanation. Specifically, after 8:00 am on 26 July, the wind speed at the site decreased rapidly, but there was still a large horizontal deflection of the tower crane and a very slow descent trend.
During the passage of the typhoon, the daily maximum displacement of the tower was predicted at 8:00 am on 25 July, based on the real-time wind speed data provided by the IoT cloud platform. Using the 3 s gust wind speed of 40.86 m/s measured at 7:40 a.m. as input, the trained RBF and BP neural network models were used to predict the daily maximum displacement of the tower along the height, and the results are shown in Figure 15. It can be seen that the daily maximum displacements predicted by the RBF and BP models are 660.8 mm and 690.35 mm, respectively. In contrast, the predicted result of the RBF model is closer to the actual displacement result (i.e., 648.73 mm). In addition, the tip of the tower will not experience significant deflection compared to the body of the tower because the tip of the inoperative tower crane will swing under the impact of the typhoon. However, the prediction results of two models still show obvious deviations, which need to be improved in the later stage.
6. Conclusions
This paper took an upper slewing tower crane installed in the southeastern coastal region of China as the research object. In order to achieve long-term monitoring of the whole process of tower crane operation, a real-time tower crane structural response monitoring system, based on the IoT, was built. Based on RBF and BP neural network algorithms and a large number of monitoring samples, two tower crane structural displacement response prediction models were established. During the passage of super typhoon In-Fa, the daily maximum deflection of the tower crane structure was predicted in advance, which was in good agreement with the actual displacement response data obtained from IoT monitoring. The specific findings are as follows:
- (1)
- Under the effect of the typhoon, the upper part of the non-working tower crane will rotate, resulting in no significant deflection of the tower tip compared to the tower body.
- (2)
- The non-working tower has a response lag, which means that its maximum displacement does not correspond to the maximum wind speed moment at the site. This is mainly due to the weathercock effect of the non-working tower; that is, when the upper structure of the tower is at a certain angle to the wind direction, the tower slewing mechanism will rotate around the tower axis, and the continuous change of the windward area of the tower will cause the load response lag; when it slews to parallel with the wind direction and is stable and no longer slews, the windward area is minimal, and its displacement will gradually become smaller.
- (3)
- The weathercock effect of the tower crane provides a scenario application for the machine learning-based prediction model proposed in this paper, which can provide timely and effective structural safety warnings for tower cranes. At the same time, it can provide useful technical references for tower structural safety warnings for the same type of the upper slewing tower cranes that do not have IoT monitoring systems installed.
It is worth mentioning that the research work in this paper has some limitations that should be improved at a later stage. First, since there is not yet a mature crane displacement monitoring system, this paper directly considers the crane displacement measured by the IoT system as the actual displacement, which is inappropriate and does not eliminate the influence of the measurement error of the monitoring equipment itself. Later, with the development of computer vision recognition technology, the accuracy of the IoT monitoring system constructed in this paper can be verified by other techniques. Second, the machine learning prediction models in this paper only consider the site wind speed, which has a large uncertainty, as an input. In fact, the authors have developed multiple scenarios in terms of selecting the input and output data for the model. For the input data, we tried to include wind speed and wind direction data, and for the output data, we tried data such as daily maximum response and instantaneous structural response, but unfortunately, the best training results so far come from the machine learning models based on wind speed data and daily maximum response data, as presented in this paper. The training results of other schemes cannot meet these requirements. In future engineering applications, we will continue to improve the machine learning models and try to add more variables to improve the prediction accuracy and generalization ability of the model. Third, it is not credible to perform model calibration using only evaluation metrics, such as mean square error, and more metrics are needed for subsequent validation. Finally, in the case of this paper, the machine learning model successfully predicted the daily maximum displacement in advance (by 1 h), saving valuable time for crane safety work, but whether the prediction model can really work for other types of tower cranes in other construction projects needs to be verified by a large number of subsequent experiments.
Author Contributions
Conceptualization, Q.L.; writing—original draft preparation, H.J. and J.M.; writing—review and editing, J.Z. and W.F.; supervision, M.H. All authors have read and agreed to the published version of the manuscript.
Funding
This study was supported by the National Natural Science Foundation of China (52001276, 52108177, 52178512), the Natural Science Foundation of Zhejiang Province (LZ22E080006, LY23E080005), the Ningbo Public Welfare Science and Technology Plan Project (2022S174, 2022S176, 2021S094), the Ningbo Natural Science Foundation (2022J158, 2021J168), the Ningbo Education Science Planning Project (CY22032), the Ningbo Key Research and Development Program (2022Z165), and the International Scientific and Technological Cooperation Program of Ningbo (2023H008).
Institutional Review Board Statement
Not applicable.
Informed Consent Statement
Not applicable.
Data Availability Statement
Some or all data and models that support the findings of this study are available from the corresponding author upon reasonable request.
Acknowledgments
We thank the Ningbo Kaihong Engineering Consulting Co. for providing the research object for this paper.
Conflicts of Interest
The authors declare no conflict of interest.
Abbreviations
| IoT | Internet of things |
| CFD | computational fluid dynamics, https://www.ansys.com/zh-cn/products/fluids/ansys-fluent/ (accessed on 23 February 2023). |
| ANSYS | finite element analysis software developed by ANSYS, USA, https://www.ansys.com/ (accessed on 23 February 2023). |
| RBF | radical basis function |
| BP | back propagation |
| WRF | Weather Research and Forecasting, https://www.wrf-model.org/ (accessed on 23 February 2023). |
References
- Voisin, D.; Grillaud, G.; Solliec, C.; Beley-Sayettat, A.; Berlaud, J.-L.; Miton, A. Wind tunnel test method to study out-of-service tower crane behaviour in storm winds. J. Wind. Eng. Ind. Aerodyn. 2004, 92, 687–697. [Google Scholar] [CrossRef]
- Lee, S.-J.; Kang, J.-H. Wind load on a container crane located in atmospheric boundary layers. J. Wind. Eng. Ind. Aerodyn. 2008, 96, 193–208. [Google Scholar] [CrossRef]
- Kang, J.-H.; Lee, S.-J. Experimental study of wind load on a container crane located in a uniform flow and atmospheric boundary layers. Eng. Struct. 2008, 30, 1913–1921. [Google Scholar] [CrossRef]
- Lee, J.-H.; Kim, T.-W.; Jang, I.-G.; Han, S.-H. Wind Force Coefficients Computation of Gantry Crane by Wind Tunnel Experiment and Structural Analysis of the Crane. J. Soc. Nav. Arch. Korea 2011, 48, 165–170. [Google Scholar] [CrossRef]
- Han, D.-S.; Han, G.-J. The difference in the uplift force at each support point of a container crane between FSI analysis and a wind tunnel test. J. Mech. Sci. Technol. 2011, 25, 301–308. [Google Scholar] [CrossRef]
- Klinger, C. Failures of cranes due to wind induced vibrations. Eng. Fail. Anal. 2014, 43, 198–220. [Google Scholar] [CrossRef]
- Jerzy, T.; Jacek, C.; Andrzej, K. Dynamics of an overhead crane under a wind disturbance condition. Autom. Constr. 2014, 42, 100–111. [Google Scholar]
- Dong, D.S.; Yu, H. CFD wind load study of a typical tower crane double box girder structure. Chin. J. Constr. Mach. J. 2009, 7, 7–12. (In Chinese) [Google Scholar]
- Cao, Y. Research on the static and dynamic characteristics of flexible attached tower crane structural system. Ph.D. Thesis, Southwest Jiaotong University, Chengdu, China, 2011. (In Chinese). [Google Scholar]
- Gu, Y.Q.; Guo, S.D. Preliminary analysis of wind vibration effect of tower crane. Mod. Mach. 2012, 3, 44–46. (In Chinese) [Google Scholar]
- Zhu, X.H.; Cheng, W.M.; Shao, J.B. Study on wind vibration characteristics of large portal cranes. Mech. Des. Manuf. (In Chinese). 2013, 2, 63–66. [Google Scholar]
- Zhang, J.J.; Zhang, Q.; Qin, X.R.; Jing, H.P. Analysis of wind load characteristics of a 7500 ton floating crane. J. Hunan Univ. (Nat. Sci. Ed.) 2014, 41, 76–80. (In Chinese) [Google Scholar]
- Ma, J.; Wang, Z.T.; Zhou, D.; Duan, Z. Wind-induced dynamic response and fatigue analysis of a typical crane tower structure. J. Shanghai Jiaotong Univ. 2014, 48, 804–808. (In Chinese) [Google Scholar]
- Cui, S.J.; Fan, S.C.; Guan, X.T.; Li, Q. Dynamic characteristics of moving jib tower cranes and their influence analysis. Mach. Des. 2015, 32, 66–69. (In Chinese) [Google Scholar]
- Fu, K.; Yu, L.F.; Cheng, B.; Yang, Q.S. Analysis of wind-induced response of tower crane structure. Mod. Manuf. Eng. (In Chinese). 2017, 9, 138–142. [Google Scholar]
- Chen, W.; Qin, X.R.; Yang, Z.G. Analysis of wind load characteristics of tower crane tower and hoist arm. J. Zhejiang Univ. (Eng. Ed.) 2018, 52, 2262–2270. (In Chinese) [Google Scholar]
- Wang, T.F. Research on wind-induced vibration analysis and wind vibration control of portal crane. Ph.D. Thesis, Zhongbei University, Taiyuan, China, 2019. (In Chinese). [Google Scholar]
- Lu, Y.; Gao, M.; Liang, T.; He, Z.; Feng, F.; Pan, F. Wind-induced vibration assessment of tower cranes attached to high-rise buildings under construction. Autom. Constr. 2022, 135, 104–132. [Google Scholar] [CrossRef]
- Jiang, W.; Ding, L.; Zhou, C. Digital twin: Stability analysis for tower crane hoisting safety with a scale model. Autom. Constr. 2022, 138, 104–257. [Google Scholar] [CrossRef]
- GB50009-2012; Building Structure Load Code. China Standards Press: Beijing, China, 2012. (In Chinese)
- Vickery, P.J.; Skerlj, P.F.; Twisdale, L.A. Simulation of Hurricane Risk in the U.S. Using Empirical Track Model. J. Struct. Eng. 2000, 126, 1222–1237. [Google Scholar] [CrossRef]
- Powell, M.; Soukup, G.; Cocke, S.; Gulati, S.; Morisseau-Leroy, N.; Hamid, S.; Dorst, N.; Axe, L. State of Florida hurricane loss projection model: Atmospheric science component. J. Wind. Eng. Ind. Aerodyn. 2005, 93, 651–674. [Google Scholar] [CrossRef] [Green Version]
- James, M.K.; Mason, L.B. Synthetic Tropical Cyclone Database. J. Waterw. Port Coast. Ocean Eng. 2005, 131, 181–192. [Google Scholar] [CrossRef]
- Emanuel, K.; Ravela, S.; Vivant, E.; Risi, C. A Statistical Deterministic Approach to Hurricane Risk Assessment. Bull. Am. Meteorol. Soc. 2006, 87, 299–314. [Google Scholar] [CrossRef]
- Lee, K.H.; Rosowsky, D.V. Synthetic hurricane wind speed records: Development of a database for hazard analysis and risk studies. Nat. Hazards Rev. 2007, 8, 23–34. [Google Scholar] [CrossRef]
- Vickery, P.J.; Wadhera, D.; Twisdale, L.A.; Lavelle, F.M. U.S. Hurricane Wind Speed Risk and Uncertainty. J. Struct. Eng. 2009, 135, 301–320. [Google Scholar] [CrossRef]
- Li, S.H.; Hong, H.P. Observations on a Hurricane Wind Hazard Model Used to Map Extreme Hurricane Wind Speed. J. Struct. Eng. 2015, 141, 04014238. [Google Scholar] [CrossRef]
- Li, S.H.; Hong, H.P. Typhoon wind hazard estimation for China using an empirical track model. Nat. Hazards 2016, 82, 1009–1029. [Google Scholar] [CrossRef]
- Chen, Y.; Duan, Z. A statistical dynamics track model of tropical cyclones for assessing typhoon wind hazard in the coast of southeast China. J. Wind. Eng. Ind. Aerodyn. 2018, 172, 325–340. [Google Scholar] [CrossRef]
- Fang, G.; Zhao, L.; Cao, S.; Zhu, L.; Ge, Y. Estimation of tropical cyclone wind hazards in coastal regions of China. Nat. Hazards Earth Syst. Sci. 2020, 20, 1617–1637. [Google Scholar] [CrossRef]
- Nguyen, C.H.; Owen, J.S.; Franke, J.; Neves, L.C.; Hargreaves, D.M. Typhoon track simulations in the North West Pacific: Informing a new wind map for Vietnam. J. Wind. Eng. Ind. Aerodyn. 2020, 208, 104441. [Google Scholar] [CrossRef]
- Jing, R.; Lin, N. Tropical Cyclone Intensity Evolution Modeled as a Dependent Hidden Markov Process. J. Clim. 2019, 32, 7837–7855. [Google Scholar] [CrossRef] [Green Version]
- Huang, M.; Wang, Q.; Li, Q.; Jing, R.; Lin, N.; Wang, L. Typhoon wind hazard estimation by full-track simulation with various wind intensity models. J. Wind. Eng. Ind. Aerodyn. 2021, 218, 104792. [Google Scholar] [CrossRef]
- JG/T 100-1999; Regulations for the Operation of Tower Cranes. China Standards Press: Beijing, China, 1999. (In Chinese)
- JGJ33-2012; Technical Regulations for Safety in the Use of Construction Machinery. China Standards Press: Beijing, China, 2012. (In Chinese)
- Schilling, R.; Carroll, J.; Al-Ajlouni, A. Approximation of nonlinear systems with radial basis function neural networks. IEEE Trans. Neural Netw. 2001, 12, 1–15. [Google Scholar] [CrossRef] [PubMed] [Green Version]
- Xu, K.; Wang, G.; Zhang, L.; Wang, L.; Yun, F.; Sun, W.; Wang, X.; Chen, X. Multi-Objective Optimization of Jet Pump Based on RBF Neural Network Model. J. Mar. Sci. Eng. 2021, 9, 236. [Google Scholar] [CrossRef]
- Li, Q.; Jia, H.T.; Qiu, Q.; Lu, Y.Z.; Zhang, J.; Mao, J.H.; Fan, W.J.; Huang, M.F. Typhoon-induced fragility analysis of trans-mission towers in Ningbo area considering the effects of long-term corrosion. Appl. Sci. 2022, 12, 4774. [Google Scholar] [CrossRef]
- Li, Q.; Zhang, J.; Wang, R.; Liu, J.; Li, P. Typhoon-resistant performance assessment of coastal rural residential keel brick walls rein-forced with high ductility concrete. J. Mar. Sci. Eng. 2022, 10, 1766. [Google Scholar] [CrossRef]
- Li, Q.; Jia, H.; Zhang, J.; Mao, J.; Fan, W.; Huang, M.; Zheng, B. Typhoon Loss Assessment in Rural Housing in Ningbo Based on Township-Level Resolution. Appl. Sci. 2022, 12, 3463. [Google Scholar] [CrossRef]
- Li, Q.; Mao, J.H.; Huang, M.F. Extreme wind speed estimation of mixed climate combined with typhoon full path simulation. J. Vib. Shock 2020, 39, 84–89. (In Chinese) [Google Scholar]
Figure 1.
Upper slewing tower crane (Image by Qiang Li).

Figure 2.
Inclination sensor.

Figure 3.
Ultrasonic anemometer.

Figure 4.
Instrument layout and its coordinate system.

Figure 5.
Detailed view of sensor arrangement.

Figure 6.
Relative position of anemometer and tower site (Image by Qiang Li).

Figure 7.
Topology of the IoT system for the tower crane.

Figure 8.
(a) Tower crane working condition records. (b) Offset of tower crane measurement points.

Figure 9.
Construction of tower displacement response prediction model.

Figure 10.
Error convergence curve; (a) BP neural network; (b) RBF neural network.

Figure 11.
Comparison of model calibration errors.

Figure 12.
(a) Wind field map as the typhoon passed over the construction site; (b) wind rose diagram for the duration of the typhoon.
Figure 12.
(a) Wind field map as the typhoon passed over the construction site; (b) wind rose diagram for the duration of the typhoon.

Figure 13.
Typhoon wind speed measured at the site during the transit of typhoon In-Fa.

Figure 14.
The actual offset of the tower measured by the IoT monitoring system during the transit of typhoon In-Fa.
Figure 14.
The actual offset of the tower measured by the IoT monitoring system during the transit of typhoon In-Fa.

Figure 15.
Comparison of the predicted daily maximum displacement of the tower with the actual measured data.
Figure 15.
Comparison of the predicted daily maximum displacement of the tower with the actual measured data.


Table 1.
Offset of each measuring point of the tower crane after completing work (17:00, 14 April 2021).
Table 1.
Offset of each measuring point of the tower crane after completing work (17:00, 14 April 2021).
| No. | 1610 | 1611 | 1612 | 1613 | 1614 | 1615 | 1616 |
|---|---|---|---|---|---|---|---|
| Offset (mm) | 17.45 | 17.45 | 17.45 | 33.16 | 48.87 | 48.87 | 66.30 |
Disclaimer/Publisher’s Note: The statements, opinions and data contained in all publications are solely those of the individual author(s) and contributor(s) and not of MDPI and/or the editor(s). MDPI and/or the editor(s) disclaim responsibility for any injury to people or property resulting from any ideas, methods, instructions or products referred to in the content. |
© 2023 by the authors. Licensee MDPI, Basel, Switzerland. This article is an open access article distributed under the terms and conditions of the Creative Commons Attribution (CC BY) license (https://creativecommons.org/licenses/by/4.0/).
Share and Cite
MDPI and ACS Style
Li, Q.; Fan, W.; Huang, M.; Jin, H.; Zhang, J.; Ma, J. Machine Learning-Based Prediction of Dynamic Responses of a Tower Crane under Strong Coastal Winds. J. Mar. Sci. Eng. 2023, 11, 803. https://doi.org/10.3390/jmse11040803
AMA Style
Li Q, Fan W, Huang M, Jin H, Zhang J, Ma J. Machine Learning-Based Prediction of Dynamic Responses of a Tower Crane under Strong Coastal Winds. Journal of Marine Science and Engineering. 2023; 11(4):803. https://doi.org/10.3390/jmse11040803
Chicago/Turabian StyleLi, Qiang, Weijie Fan, Mingfeng Huang, Heng Jin, Jun Zhang, and Jiaxing Ma. 2023. "Machine Learning-Based Prediction of Dynamic Responses of a Tower Crane under Strong Coastal Winds" Journal of Marine Science and Engineering 11, no. 4: 803. https://doi.org/10.3390/jmse11040803
Note that from the first issue of 2016, this journal uses article numbers instead of page numbers. See further details here.