Electron dynamics and metastable species generation in atmospheric pressure non-equilibrium plasmas controlled by dual LF–RF frequency discharges
 Yilin Yu1
  Zhonglin Zhang
 Qiuyue Nie
- 1School of Electrical Engineering and Automation, Harbin Institute of Technology, Harbin, China
- 2School of Physics, Harbin Institute of Technology, Harbin, China
- 3Laboratory for Space Environment and Physical Sciences, Harbin Institute of Technology, Harbin, China
In this work, we report an approach to control electron dynamics and metastable species generation and enhance the density of atmospheric pressure non-equilibrium plasmas by using dual-frequency excitation sources. The atmospheric dielectric barrier discharge (DBD) of an α-mode radio frequency (RF = 5 MHz) discharge controlled by a low-frequency (LF = 50 kHz) bias is studied based on a one-dimensional (1D) fluid model. Results show that the variation in amplitude ratio of RF and LF modulates the electron dynamic process, resulting in different spatial distributions of electron and metastable particle densities. Moreover, it is further shown that the electron density is substantially increased when the LF component voltage amplitude is larger than 300 V for the initial setting. The discharge process is characterized by fast Fourier transform of the spatio-temporal evolution of the electron power absorption and discharge current. As the LF is applied, three-wave interactions induced by LF and RF coupling are clearly observed, where the sum and beat frequencies between LF and RF are increased, which results in a substantial increase in the electron density. On the other hand, the high RF harmonics, especially for the fundamental and the third harmonic components, are suppressed when increasing the LF component. This work demonstrates that dual-frequency excitation is efficacious to modulate the electron dynamic behaviors and metastable species generation of atmospheric pressure plasma, which can provide a possible approach of optimizing plasma parameters.
1 Introduction
Atmospheric pressure (AP) cold plasmas have extensive applications due to their unique features, such as simple and convenient operation processes, high electron densities, low gas temperatures, and plenty of reactive particles. Particularly, dielectric barrier discharges (DBDs), as a conventional way to generate high-density plasmas with a low temperature at atmospheric pressure, have many applications not only in traditional fields, such as sterilization [1], deactivation of bacteria/virus/cancer cells [2–5], would healing [6], and exhaust gas cleaning [7], but also in emerging areas such as special material surface treatment/modification [8, 9], air-flow control [10] and semiconductor manufacturing [11]. Recently, studies for gas–liquid interface interactions by DBD structures have also provoked great interests [12].
The DBD system usually has a wider parameter range, with the electron density varying in the 1017–1020 m-3 regime, depending on discharge modes (diffusive, pattern, or filamentous) and driving methods [13–15]. In a traditional DBD ignition mode often with a single driving source, the driving frequency is increased from kHz [16] to MHz [17]. For the single ∼ kHz driving, the discharge current develops in a pulse-like type, with one or several short pulses per discharge period. The discharge is mainly in a filamentous form, with higher electron densities in significant non-uniformity or lower electron densities in a mild diffusive mode. As the driving frequency increases to MHz, the discharge characteristics become quite different from those of the kHz driving case, typically with better spatial uniformity and higher electron density. Meanwhile, the breakdown voltage under the MHz radio frequency (RF) driving is only about a third of that in the kHz low-frequency (LF) driving condition, which makes the RF DBD very attractive. In spite of the aforementioned advantages of DBD, challenges still remain in the directional parameter optimizing and parameter de-coupling. Especially, for bio-medicine applications, it is tough to make a trade-off between demands of a higher particle density and an acceptable gas temperature [18]. In order to independently control desired plasma parameters, modulation by dual frequencies (DF) and/or tailored voltage has been proposed and demonstrated to modify the power dissipation and electron dynamics, particularly the electron heating process, and thus to achieve the demanded DBD plasma parameters [19, 20]. For instance, Liu et al. adopted a frequency combination of 200 kHz/13.56 MHz to investigate the effect and mechanism of each frequency component on the DF discharge [21]. They demonstrated that the DF excitation provided a higher input power and improved discharge uniformity, with potential applications in plasma-assisted surface processing [22]. On the other hand, F. Massines et al. investigated the influences of amplitude and frequency of applied voltages on DF-excited DBD plasmas in a wide voltage range [23, 24]. Particularly, the influence of LF voltage amplitude on the RF discharge process and the mode transition from α to α-γ were studied [25]. Recently, our results also show that DF and tailored voltage waveform excitation are valid approaches to achieve independent control and optimization over both electron density and gas temperature in AP–DBD systems [26–30]. However, the electron dynamic behaviors and the mechanisms of particle density directional optimization still remain unclear and unresolved in AP non-equilibrium plasma studies.
In this work, we adopt dual-medium frequencies of 50 kHz/5 MHz to study the influence and control of electron dynamics and metastable species generation and thereby provide the plasma density directional optimization strategy and its mechanisms. Moreover, we provide a theoretical explanation for our previous work of plasma density directional optimization [26], namely, the electron density has a substantial increase, but gas temperature has no obvious increase. The paper is organized as follows: a simplified simulation model and its analytic method are described in Section 2. The simulation results are shown and discussed in Section 3. Then, a short summary of the work is given in Section 4.
2 Model description
In order to further understand and describe the complex physical and chemical processes of AP–DBD systems (in particular their electron dynamics), a time-dependent 1D drift–diffusion model with the plasma platform PLASIMO was used in this work, and details about PLASIMO are shown in [21, 30, 31]. In the model, particle transport equations for the electron, ion, and metastable species are solved in drift–diffusion approximation, where the electrical field is given by Poisson’s equation. The energy transport equation is also applied for the electron only with a cold ion assumption. Argon is used as the working gas in this work. Four species, i.e., e (electrons), Ar*, Ar+, and Ar2+, are considered for argon chemical kinetics, with detailed information on related reactions being listed in Table 1. The diffusion coefficient of metastable argon is calculated by the collision integral method [36]. The electron mobility is calculated as a function of the mean electron energy W from the electron energy distribution function (EEDF) by using the Boltzmann solver BOLSIG+ [37], where the chemical reaction rate coefficients involving electrons are also obtained.
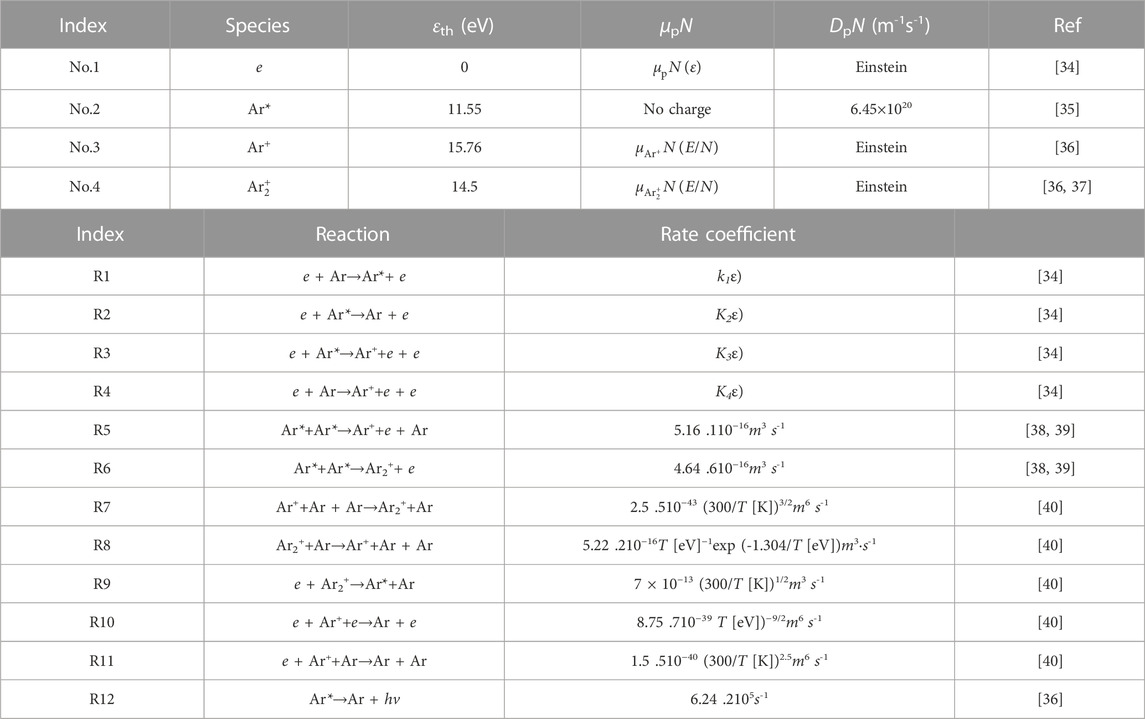
TABLE 1. Transport coefficients and associated reactions.
2.1 Governing equations and boundary conditions
In this work, since the area of the electrode is much larger than the discharge gas gap, the drift–diffusion model can simulate the development of the discharge. Four species mentioned previously are mainly considered in this model. The Ar* is in the 4s excited state, and the lifetime of the 4s excited state of Ar* is 100–140 ns. In the vicinity of this excited level, there are many semblable levels, and they can transform with each other quickly; hence, we consider these particles as metastable particles. The spatial and temporal distribution of particles is described with the continuity equation:
Here, nr is the number density of r-th particles, including e, Ar*, Ar+, and Ar2+. Sr is the source term of r-th particles, and it is calculated by
Here, ki is the reaction coefficient; αi is the Townsend coefficient; nr1, nr2, and nr3 are the reaction number densities in different equations. The Nr in Eq 1 is the r-th particle flux, and it is described as
Here, i represents Ar+ and Ar2+; E is the electric field; μe and μi are the mobility rates of electron and ions, respectively. The ion mobility rate is the function of the reduced electric field (E/n), and the electron mobility rate is the function of the mean electron energy, which is solved by Boltzmann equation. De, Di, and DAr* are the diffusion coefficients of e, ion, and Ar*, respectively, which are calculated by Einstein relation:
Here, e is the elementary charge, Ti is the temperature of the i-th particle, and kB is the Boltzmann constant. In this work, the electric field is solved by Poisson’s equation:
Here, φ is the electric potential and ε is the dielectric constant. The discharge circuit is calculated by Kirchhoff’s voltage law (KVL):
Here, Va(t) is the applied voltage, Vd(t) is the dielectric voltage and the loop circuit, and i1(t) is obtained by the Morrow–Sato equation.
In this model, we assume the positive ion particles are totally recombined when they impact on the cathode dielectric layer, and hence the boundary condition cathode is considered as
Here,
The secondary electron emission induced by the positive ion impact on the cathode dielectric surface has been considered by
Here, γ is the secondary electron emission coefficient; αe1 and αe2 are the coefficients which relate to the electric field of the boundary and are expressed as
The boundary of electron energy is related to the electrons, and hence they have a similar form. Since the generation mechanism of secondary electron emission is fairly complicated in dielectric barrier discharge, we simplify the mean secondary electron energy as 2.5 eV, which is approximately identical to the mean electron energy near the plasma sheath. The boundary of electron energy is simplified as
Here,
For the metastable atom, we assume they totally de-excitate to the ground state atoms, and the boundary condition is written as
For the electric field, the dielectric surface can simulate the charge, and the electric flux in the dielectric surface is discontinuous.
Here, Dg is the electric flux in the ground electrode, Da is the electric flux in the applied excitation electrode, and σ is the surface charge density obtained by
The related species reactions and their associated transport coefficients in this work are shown in Table 1. The sketch of the DBD model in this work is shown in Figure 1.
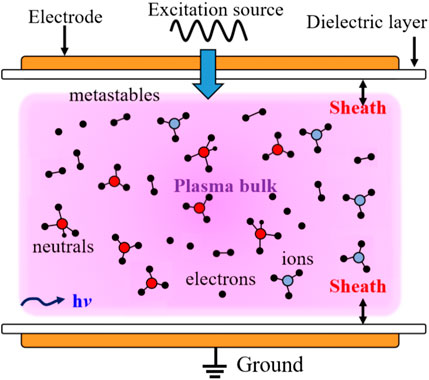
FIGURE 1. Model sketch of dynamics and energy transport processes in a DBD plasma.
2.2 Discharge conditions and benchmark
We first verify the validity of the model by comparing the numerical and experimental results for similar conditions in single LF or RF DBD. The discharge plasma is generated and sustained in a geometrically symmetric parallel-plate DBD configuration. The dielectric material we adopt is polyethylene terephthalate (PET), whose relative permittivity (dielectric constant) and thickness are ε = 3.4 and dB = 1 mm, respectively. The gas gap between the two layers is fixed as dg = 2 mm. The secondary electron emission coefficient of the dielectric material is 0.07. The gas temperature at the dielectric layer boundary is fixed at Tg = 400 K (
Figure 2 presents a typical discharge waveform, including applied and discharge current density, driven by a 50 kHz@1.2 kV LF (the upper row) as well as a 5 MHz@0.7 kV RF (the lower row), respectively, and the corresponding spatio-temporal distributions of the electric field and electron density during two discharge periods. The discharge current density is characterized by a short pulse per half cycle in the LF driving case and approximately sinusoidal in the RF case. As the driving frequency increases from ∼kHz to ∼ MHz, both the electric field and the electron density increase gradually, due to the higher electrical oscillation compressing the sheath electron density. Both numerical results of the individual LF or RF discharge presented here are clearly in good agreements with previous numerical and experimental results under the similar condition [24].
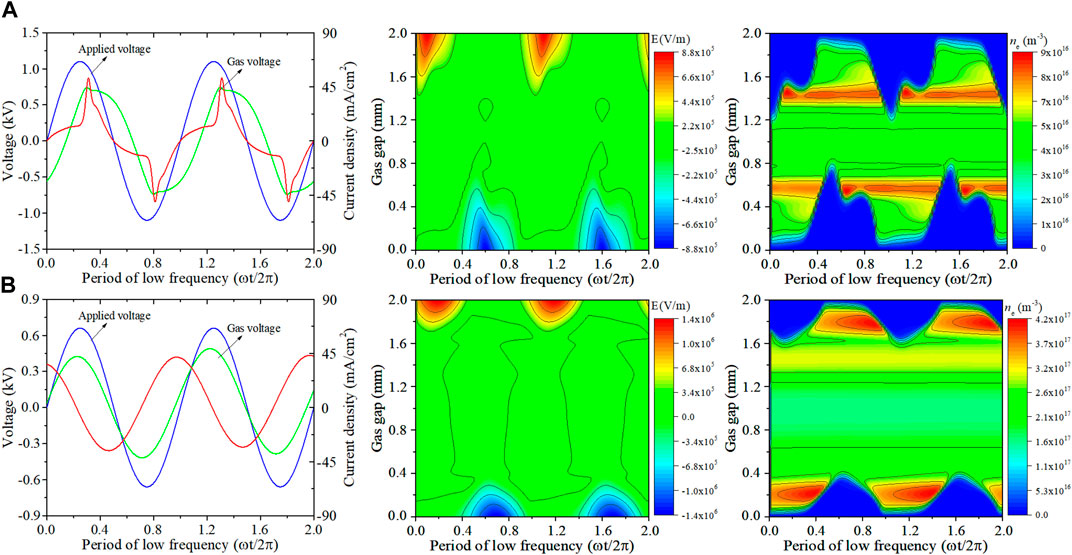
FIGURE 2. Time-dependence of the discharge voltage–current characteristic, electric field, and electron density, respectively, in the low-frequency-only discharge of 50 kHz@1.2 kV (A) and in the high-frequency-only discharge of 5 MHz@0.7 kV (B).
3 Results and discussions
This work aimed to understand the impact factors on electron dynamics and metastable species generation in the DF discharge process, and thereby obtain the electron density/temperature control and modulation strategies by dual-frequency (LF-RF) excitation. First, we try to find the DF governance patterns, e.g., the LF-dominant, the DF-comparable, or the HF-dominant, and then focus on the different ratios and corresponding plasma parameters. Thereafter, we analyze electron dynamics and control and optimization mechanisms.
3.1 Governance patterns of DF DBD
The governance pattern of DF discharges can be simply described by the ratio of LF to RF voltage amplitudes with fixed dual frequencies. In this work, with fL = 50 kHz/fH = 5 MHz, we gradually vary the LF (50 kHz) voltage from 0 to 1500 V and alter the RF (5 MHz) voltage from 0 to 400 V. Figure 3 presents typical discharge waveforms under various voltage amplitude ratios of LF/RF. For the LF-dominant discharge mode with a ratio of VLF = 850 V/VRF = 150 V, as shown in Figure 3A, the discharge current density (red line) oscillates in the high frequency of the RF and is enveloped by a pulse-like waveform during the low-frequency period. When reducing the ratio to VLF = 700 V/VRF = 300 V, although the voltage curve (blue line) is still LF-dominant, the discharge current density waveform is in an LF-modulated quasi-sinusoidal oscillation, as shown in Figure 3B. We then call the discharge mode in this case as a DF-comparable mode. The discharge current pattern clearly distinguishes various discharge mechanisms and plasma parameter regimes. Furthermore, lowering the ratio to VLF = 100 V/VRF = 400 V, the discharge is then clearly dominated by the RF component, and the discharge current density exhibits a completely high-frequency oscillation, with the discharge characteristic not essentially different from the RF-only driving. Hence, its feature is similar to that of the HF-only discharges.
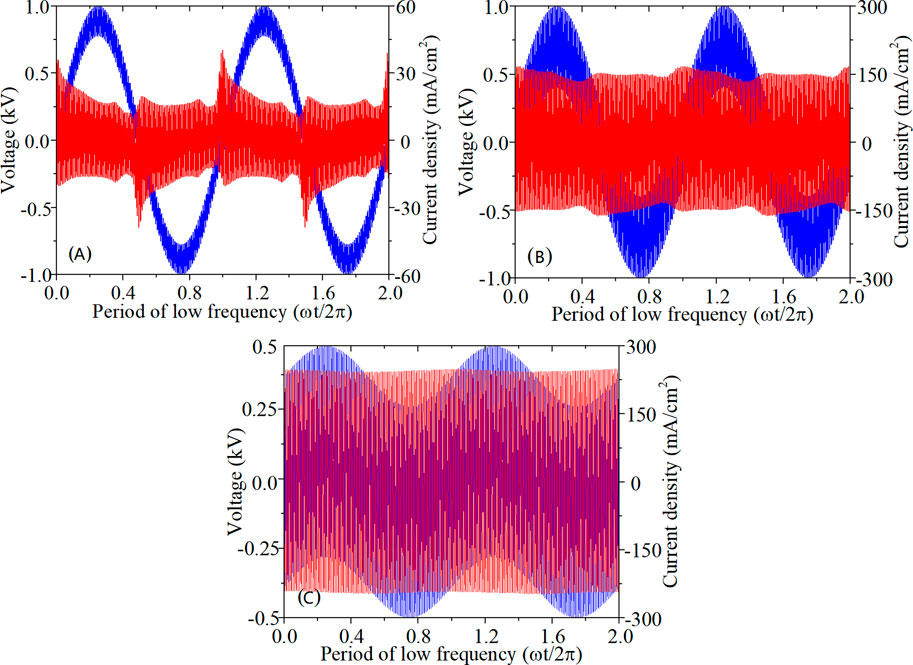
FIGURE 3. Time-dependence of the applied voltage (blue lines) and discharge current density (red lines) over two low-frequency periods with fL = 50 kHz and fH = 5 MHz; the voltage ratios of (A) VL = 0.85 kV/VH = 0.15 kV, (B) VL = 0.7 kV/VH = 0.3 kV, and (C) VL = 0.1 kV/VH = 0.4 kV.
To better understand and distinguish the aforementioned governance patterns, we show in Figure 4 the spatial distributions of feature parameters, including electron/argon ions/metastable ion densities and electron temperature, in the discharge gas gap, which are temporally averaged over an LF period. Obviously, one can see a sheath region near the boundary, characterized by the significant variations of particle densities (ne, nAr+, and nAr*). For the LF-dominant discharge, as shown in Figure 4A, the electron density decreases substantially near the boundary to form a sheath. In addition, the LF component dominates the discharge and induces the cathode sheath expansion and decreases the plasma bulk region and the density compared with the DF-comparable mode and the HF-dominant mode, as shown in Figures 4B, C, respectively. This can be explained by the increase in the ion loss due to the drift to the cathode by the strong LF electric field [24]. The electron temperature in the bulk plasma decreases to its bottom level at x = 0.5–1.5 mm, due to the higher electron power absorption in this region. For the single-frequency dielectric barrier discharge, the electron temperature has a strong coupling with electron power absorption, i.e., if the power absorption increases so does the electron temperature. For the dual-frequency discharge, the higher frequency oscillation within a period of low frequency can effectively capture the electron and trap electrons within plasma sheaths. The sheath thickness is similar to that in the RF-only DBD discharge, but the electric field in the sheath region is much stronger. The peaks of particle densities are located at the central region where the electron temperature reaches its minimum.
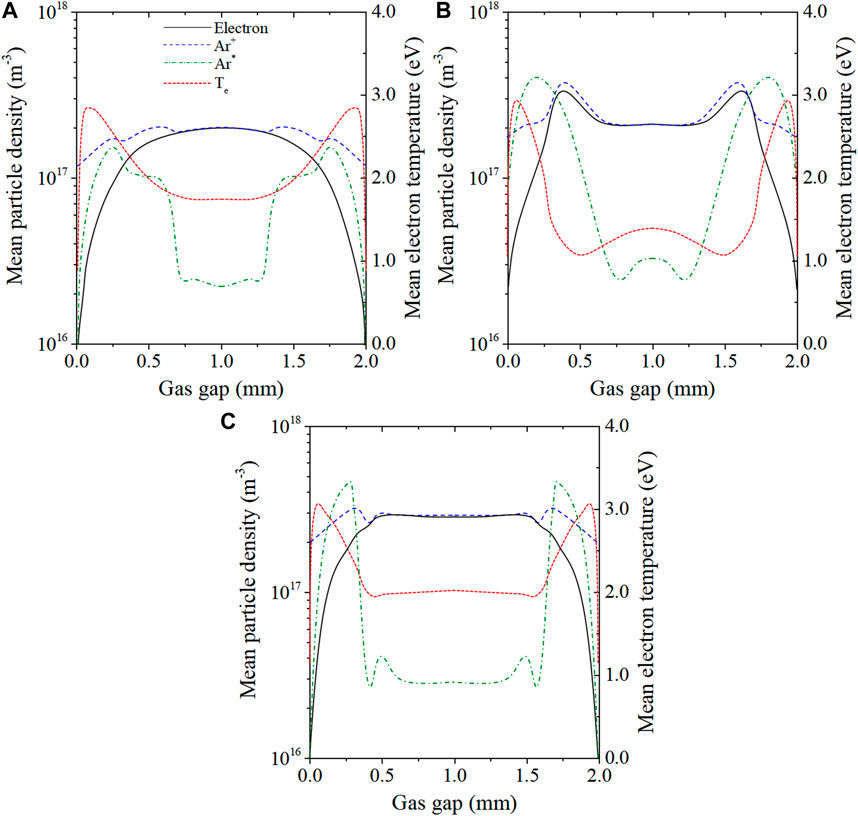
FIGURE 4. Time-averaged spatial distributions of particle densities and the electron temperature in (A) the LF-dominant mode of VLF = 0.85 kV/VRF = 0.15 kV, (B) the DF-comparable mode of VLF = 0.7 kV/VRF = 0.3 kV, and (C) the HF-dominant mode of VLF = 0.1 kV/VRF = 0.4 kV.
For the DF-comparable mode, as shown in Figure 4B, as the proportion of the HF component increases, all particle densities increase while the electron temperature steeply decreases in the plasma bulk region. The minimum value of electron temperature occurs at the sheath edge due to the enhanced direct ionization and strong RF electric field. Furthermore, the discharge in this mode is characterized by a cathode reduction on both sides of the plasma bulk region, meaning the density of ions is always large enough to cause the RF electron oscillation, which induces a space–charge electric field. For the HF-dominant mode, as shown in Figure 4C, the spatial distributions of time-averaged particle densities and electron temperature are similar to those in the RF-only DBD discharges [41, 42]. Hence, the discussion for features of the HF-dominant mode is also similar to that in the previous RF-only DBD studies.
3.2 Particle generation and distribution in various governance patterns
In Figure 5, we further show the time-averaged particle densities varied with LF and RF voltage amplitudes. In general, it is observed that all time-averaged particle densities are positively proportional to VRF. For LF voltage, however, although ne, nAr*, and nAr+ increase with the increase in VLF when VRF = 350 V, they decrease first and then increase with a turning point approximately at VLF = 200 V when VRF = 250 V or 300V. The possible reason is due to the uncompensated ion density loss at a low LF component voltage, as shown in Figure 5D. The ratio of electrons and Ar ions shows the Ar ion density has a rapid increase when VLF>300 V. As VRF reaches a high level, e.g., at VRF = 350 V, the RF component is large enough to compensate the ion loss, and hence the particle densities keep increasing with the LF voltage amplitude, and also the ratio of electrons and Ar ions presents a relatively steady increase. The electron density is enhanced by a factor of 4.6 (the ratio of VRF = 350 V, VLF = 1400 V, and VRF = 250 V/VLF = 100 V) by changing the LF/RF voltage amplitude ratio. Correspondingly, the densities of Ar* and Ar+ densities can be enhanced by a factor of 2.7 and 2.5, respectively.
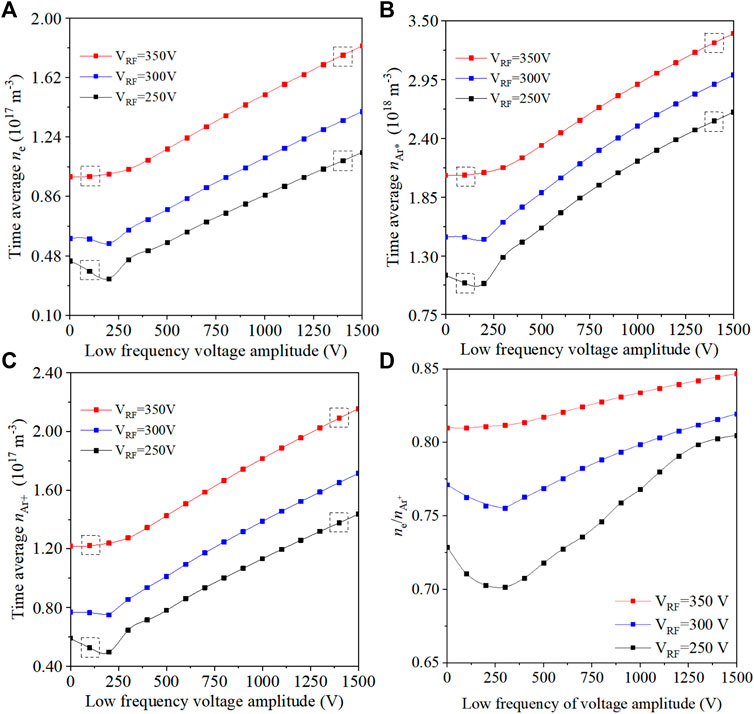
FIGURE 5. Time-averaged particle densities varied with the low frequency voltage for (A) the electron, (B) the Ar*, and (C) the Ar+, at VRF = 250, 300, and 350 V, respectively, and (D) the ratio of the maximal density electrons and Ar ions.
To gain a clear picture of the density evolution, the spatial distributions of particle densities developed in two LF periods are shown in Figure 6. In Figure 6A, one can find that for discharges dominantly controlled by LF, the maximum electron density is located near the sheath region. Modulated by the RF component, the electron density in the bulk plasma region maintains a high level, different from the electron density distribution in only LF-driven DBDs. The similar spatial distribution tendency can be observed for nAr+. For the distribution of nAr+, the maximal value is at ∼400 μm from the instantaneous cathode, near the sheath region. In the LF-dominant mode, nAr+ has a similar distribution to only LF-driven DBDs, with one peak in each LF period, but of a higher intensity. The electron-depleted region oscillates with the RF driving. Moreover, even a weak RF component can notably expand the bulk plasma region, causing further ion loss at the instantaneous cathode.
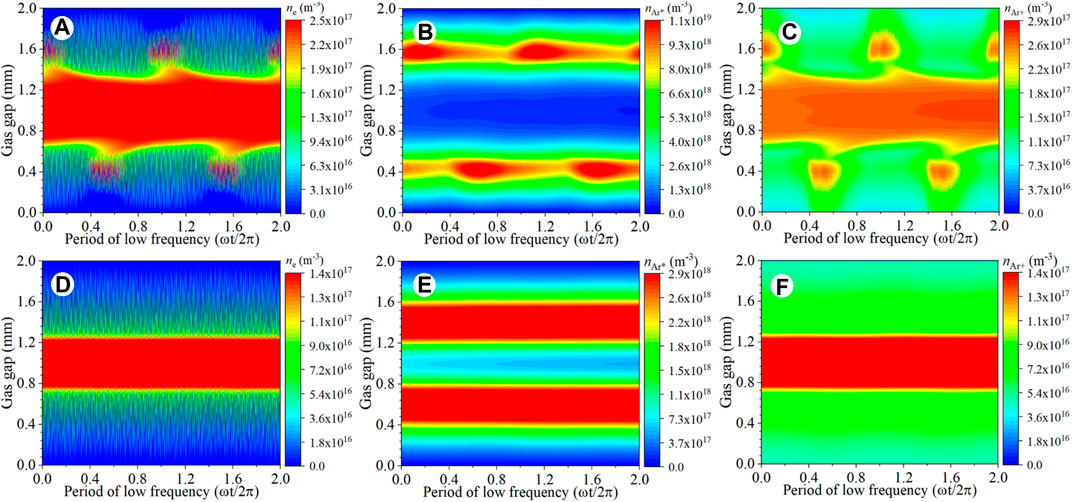
FIGURE 6. Spatial distribution of particle densities in two LF periods, for the LF-dominant mode with VL = 1300 V/VH = 350 V (the upper row) and the DF-comparable mode with VL = 550 V/VH = 350 V (the lower row), where the electron density is shown in (A, D), the metastable state in (B, E), and the ion in (C, F).
For the DF-comparable mode, the electron is mostly distributed in the plasma bulk region, with a significant electron density decrease near the sheath region, as shown in Figure 6D. In this case, LF-only DBD discharge characteristics completely disappear due to the considerable RF modulation. The Ar* species majorly distributes near the sheath region and is continuously created in the LF period. It is worth noting that all particle densities have a reduction in comparison with the LF-dominant mode. However, electron and argon ion densities only decrease slightly, while the argon metastable density decreases obviously by almost an order of magnitude. This suggests that the LF component mainly affects the metastable particle generation.
3.3 Mechanism discussion under different governance patterns
Figures 7A, B shows the spatio-temporal profiles of the power absorption (Pe,abs = Je·E) as a function of the RF voltage amplitude in two LF periods with VRF = 250 V and 350 V, respectively. It is observed that the major power absorption occurs near the plasma bulk region, which mainly results from RF ohmic heating since the power absorption intensity increases with the RF voltage. Thus, electrons can be heated throughout the LF period. To further investigate electron dynamics, the power absorption in five continuous RF periods is shown in Figures 7C, D. One can find that the discharge remains in an α-γ transition mode. In the α-γ transition mode, the plasma is driven by the electron current density and SEE. The power absorption is majorly observed in both the expansion and collapse areas of the sheath and extended into the sheath. As the RF component is enhanced, the plasma sheath is compressed and the power absorption inside the sheath increases obviously. By further increasing the RF component, the discharge then completely enters into the γ-mode (not shown here).
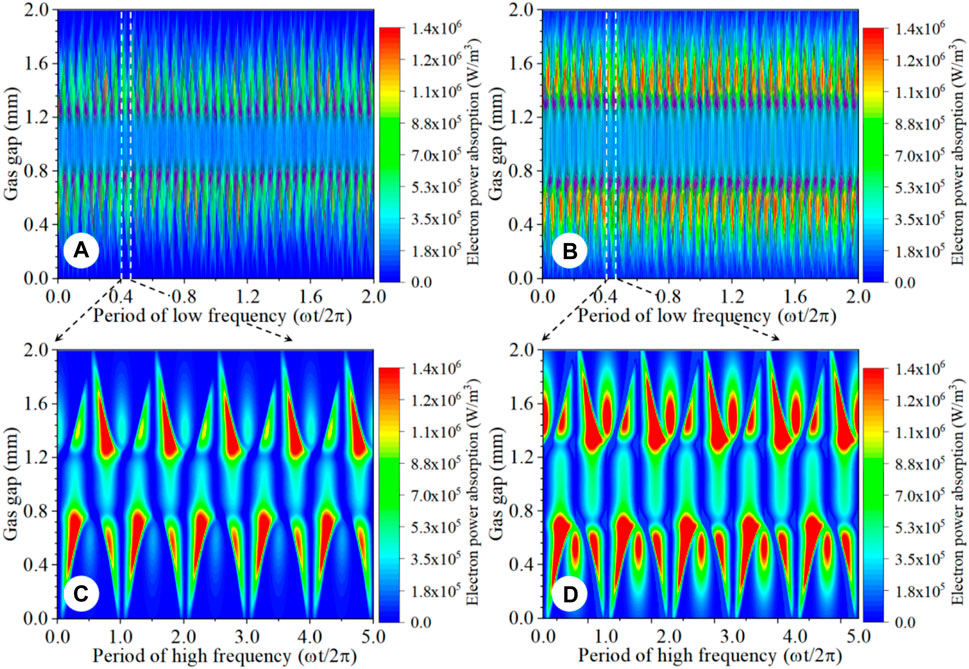
FIGURE 7. Spatio-temporal profile of the power absorption in two LF periods, for (A) VL = 100 V/VH = 250 V and (B) VL = 100 V/VH = 350 V, respectively. Moreover, (C) and (D) are in five RF periods in the selected regions corresponding to (A) and (B).
When the discharge is dominantly controlled by the LF driving, the power absorption presents a different spatio-temporal profile, as shown in Figures 8A, B. In the figures, we can see that major power absorption occurs near the sheath region, and the major excitation peaks around each LF power maximum, which is quite different from the DF-comparable mode. Increasing the RF component to 350 V, the RF oscillation begins to be apparent, as shown in Figure 8B. To show the process more clearly, the power absorption in five continuous RF periods is plotted in Figures 8C, D. In the figures, one can find an asymmetric structure of the electron power absorption. For the instantaneous cathode side, the electron power absorption occurs near the sheath region; for the instantaneous anode side, a weaker power absorption occurs at both expansion and collapse regions of the sheath. Furthermore, by increasing the RF component, the power absorption is enhanced at both sides and gets extended to the bulk plasma region from the instantaneous anode, which suggests that more secondary electrons are trapped by the enhanced RF electric field.
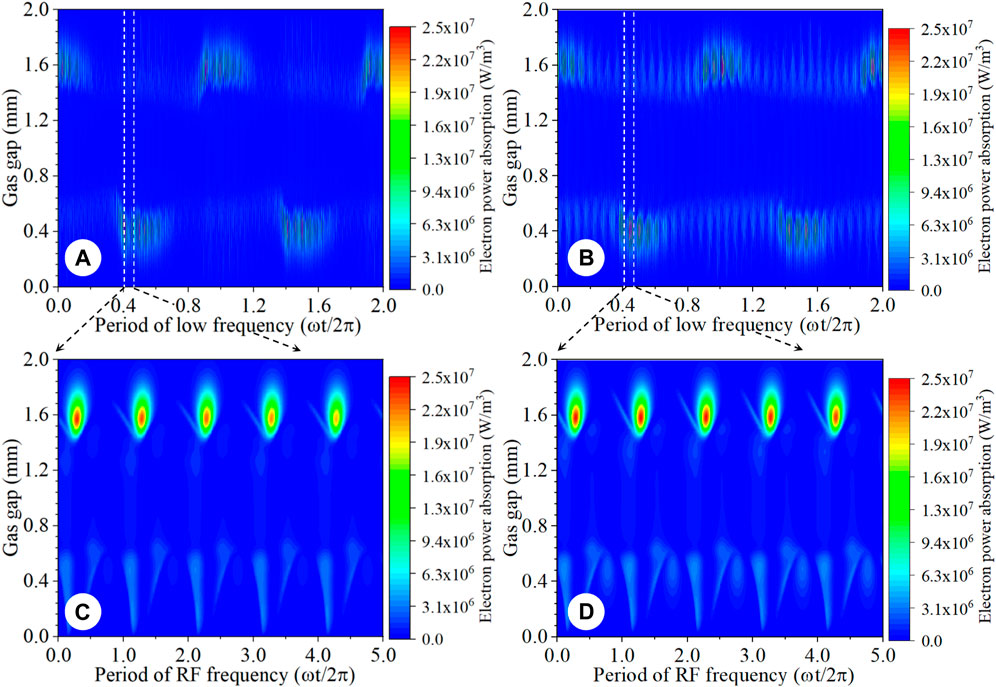
FIGURE 8. Spatio-temporal profiles of the power absorption in two low-frequency periods, for (A) VL = 1300 V/VH = 250 V and (B) VL = 1300 V/VH = 350 V, respectively. And, (C, D) are five RF period enlargements in the selected region corresponding to (A, B), respectively.
Furthermore, we investigate the influence of the DF discharge on the plasma parameters. Fast Fourier transform (FFT) of the discharge current and their associated power spectra for different discharge modes is carried out and shown in Figure 9. As a rapid and effective method to analyze non-linear phenomena, we and other groups have also applied FFT in previous studies [23, 26]. From the frequency spectrum (0–25 MHz) shown in Figure 9A, one can see that, for the discharge dominantly controlled by the LF component, apart from the fundamental frequencies of ωL = 50 kHz and ωH = 5 MHz, the third RF harmonic (3ωH = 15 MHz) and sum + beat of the LF and the second RF harmonic (2ωH + ωL and 2ωH - ωL), as well as side-bands, are also excited. Nevertheless, the second RF harmonic (2ωH) itself is too weak to be observed. These components are related to the RF amplitude modulated by the LF and reveal the frequency interaction in the discharge process by DF driving [23]. Clearly, the maximum of the power spectrum density (PSD) occurs at the fundamental RF frequency. Nevertheless, PSD at high harmonics is also substantial, as shown in Figure 9C. These results suggest that the excited high harmonics also significantly contribute to the high electron density generation.
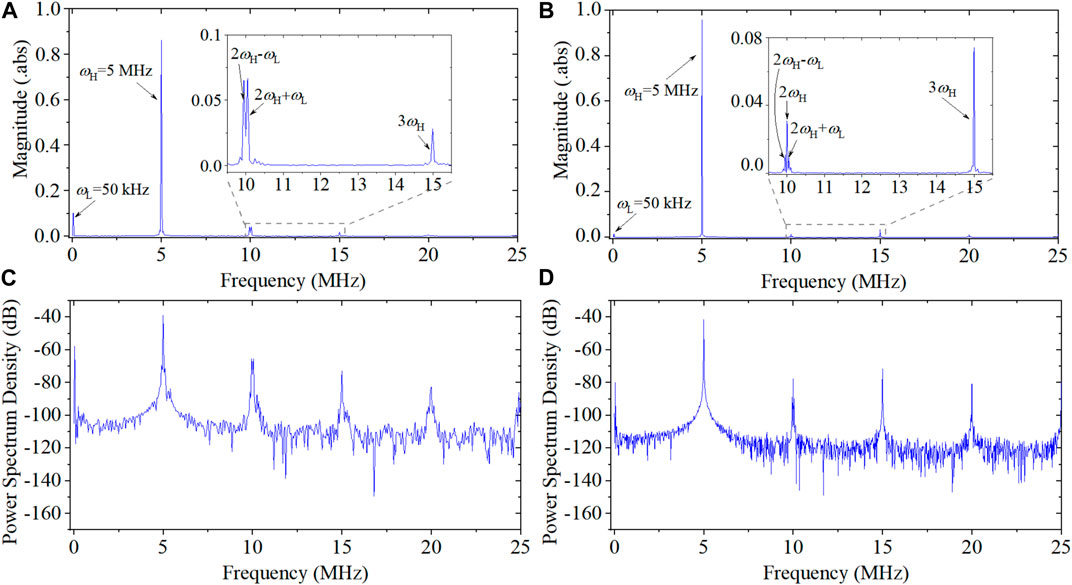
FIGURE 9. Typical fast Fourier transform (FFT) spectra and power spectral densities of the dual-DBD discharge current in the LF-dominant mode with VL = 1300 V/VH = 350 V, (A, C) and the DF-comparable mode with VL = 550 V/VH = 350 V, (B, D).
By weakening the LF component, the discharge achieves the DF-comparable mode. In this regime, the second RF harmonic structure is quite different from the LF-dominant mode. As shown in Figure 9B, not only the associated sum and beat frequencies, 2ωH + ωL and 2ωH - ωL, respectively, but also the second RF harmonic, 2ωH, are all clearly excited. Moreover, the third RF harmonic, 3ωH, is also strengthened. In the corresponding PSD shown in Figure 9D, one can find that the second RF harmonic and the LF fundamental are comparable, and other high harmonics are also more intensive than those in the LF-dominant case.
The FFT amplitudes of the discharge current as a function of LF and RF voltage amplitudes are presented in Figure 10, including some major excitation spectral lines, such as the fundamentals (ωL and ωH), the second RF harmonic (2ωH), associated beat (2ωH - ωL) and sum (2ωH + ωL), and the third RF harmonic (3ωH). As shown in Figure 10A, VLF varies from 500 V to 1500 V, with a fixed VRF = 350 V, and one can observe that as the LF component increases, the amplitudes of the LF-related components, namely, ωL, 2ωH - ωL, and 2ωH + ωL, also have an obvious increase. However, the RF component and its frequency doubling are substantially suppressed by enhancing the LF component. On the other hand, as shown in Figure 10B, VRF varies from 0 to 400 V, with a fixed VLF = 150 V. In the figure, one can see that, for VRF = 0, the discharge does not occur due to the excessively low input power. As the RF component, i.e., the fundamental, increases, its second harmonic and associated sum and beat components with the fundamental LF also increase, while the fundamental LF component is suppressed substantially. Meanwhile, the third RF harmonic is also suppressed. Combining these results with those in Figure 5, we find that, in the electron density modulation, restraining the high harmonic and increasing the sum and beat components can be an effective mechanism to obtain the desired electron density.
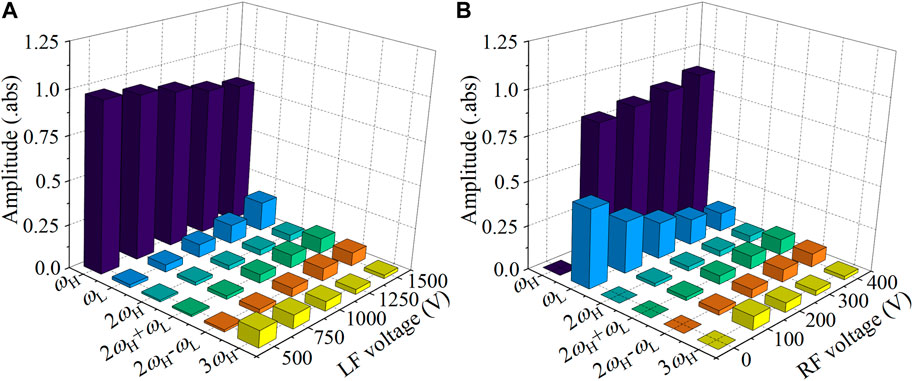
FIGURE 10. FFT components of the fundamentals (LF and RF), the second harmonic with their sum and beat, and the third harmonics in (A) the LF-dominant mode and (B) the DF-comparable mode.
4 Conclusion
In this work, we report the influence of dual-frequency (LF and RF) modulation on the electron dynamics and metastable species generation in AP DBD argon plasmas under different governance patterns described by the ratio of LF to RF as well as the balance between ion loss and creation. The study focuses on the AP DBD discharge excited by a hybrid voltage source of a 50 kHz LF plus a 5 MHz RF based on a 1D fluid model in the drift–diffusion approximation. The main conclusions of this work are listed as follow:
■ It is found that the DF discharge exists in two distinct modes depending on the LF voltage amplitude. With a 2-mm discharge gas gap and a fixed RF component, the electron density at first decreases and then increases with the increase in the LF voltage amplitude.
■ When the discharge is dominantly controlled by the LF, the ion drift to the instantaneous cathode is independent of the RF component, and more electrons are generated both in the bulk and sheath regions. Moreover, the LF component induces a significant ion loss at the instantaneous cathode, which gets more significant as the RF component increases.
■ By FFT of the current and PSD of the discharge, one can find that in the discharge driven by DF, a typical three-wave interaction can be observed. The amplitude of high RF harmonics and associated sum and beat components varies with DF discharge patterns. In the plasma density modulation, the sum and beat components of the second RF harmonic with the LF can be an effective mechanism for density enhancement.
Data availability statement
The raw data supporting the conclusion of this article will be made available by the authors, without undue reservation.
Author contributions
All authors listed have made a substantial, direct, and intellectual contribution to the work and approved it for publication.
Funding
This work was supported by the National Natural Science Foundation of China Grant No. 51907040, the Key Laboratory of Engineering Dielectrics and Its Application (Harbin University of Science and Technology), and Ministry of Education Grant No. KFM202108.
Conflict of interest
The authors declare that the research was conducted in the absence of any commercial or financial relationships that could be construed as a potential conflict of interest.
Publisher’s note
All claims expressed in this article are solely those of the authors and do not necessarily represent those of their affiliated organizations, or those of the publisher, the editors, and the reviewers. Any product that may be evaluated in this article, or claim that may be made by its manufacturer, is not guaranteed or endorsed by the publisher.
References
1. Laroussi M. Low temperature plasma-based sterilization: Overview and state-of-the-art. Plasma Process Polym (2005) 2:391–400. doi:10.1002/ppap.200400078
2. Aboubakr HA, Gangal U, Youssef MM, Goyal SM, Bruggeman PJ. Inactivation of virus in solution by cold atmospheric pressure plasma: Identification of chemical inactivation pathways. J Phys D: Appl Phys (2016) 49:204001. doi:10.1088/0022-3727/49/20/204001
3. Graves DB. Low temperature plasma biomedicine: A tutorial review. Phys Plasmas (2014) 21:080901. doi:10.1063/1.4892534
4. Kim SJ, Chung TH, Bae SH, Leem SH. Characterization of atmospheric pressure microplasma jet source and its application to bacterial inactivation. Plasma Process Polym (2009) 6:676–85. doi:10.1002/ppap.200850001
5. Adamovich I, Baalrud SD, Bogaerts A, Bruggeman PJ, Cappelli M, Colombo V, et al. The 2017 Plasma Roadmap: Low temperature plasma science and technology. J Phys D: Appl Phys (2017) 50:323001. doi:10.1088/1361-6463/aa76f5
6. Weltmann KD, von Woedtke T. Plasma medicine—Current state of research and medical application. Plasma Phys Control Fusion (2017) 59:014031. doi:10.1088/0741-3335/59/1/014031
7. Brandenburg R, Barankova H, Bardos L, Chmielewski AG, Dors M, Grosch H, et al. Plasma-based depollution of exhausts: Principles state of the art and future prospects. Rijeka, Croatia: INTECH Open Access Publisher (2011).
8. Ichiki T, Tauro R, Horiike Y. Localized and ultrahigh-rate etching of silicon wafers using atmospheric-pressure microplasma jets. J Appl Phys (2004) 95:35–9. doi:10.1063/1.1630375
9. Penkov OV, Khadem M, Lim WS, Kim DE. A review of recent applications of atmospheric pressure plasma jets for materials processing. Coat Technol Res (2015) 12:225–35. doi:10.1007/s11998-014-9638-z
10. Babayan SE, Jeon JY, Tu VJ, Park J, Selwyn GS, Hicks RF. Deposition of silicon dioxide films with an atmospheric-pressure plasma jet. Plasma Sourc Sci. Technol. (1998) 7:286–8. doi:10.1088/0963-0252/7/3/006
11. Zhang C, Huang B, Luo ZB, Che XK, Yan P, Shao T. Atmospheric-pressure pulsed plasma actuators for flow control: Shock wave and vortex characteristics. Plasma Sourc Sci. Technol. (2019) 28:064001. doi:10.1088/1361-6595/ab094c
12. Park S, Choe W, Lee H, Park JY, Kim J, Moon SY, et al. Stabilization of liquid instabilities with ionized gas jets. Nature (2021) 592:49–53. doi:10.1038/s41586-021-03359-9
13. Fan WL, Sheng ZM, Liu FC, Zhong XX, Dong LF. Mechanisms of fine structure formation in dielectric barrier discharges. Phys Plasmas (2018) 25:023502. doi:10.1063/1.5006345
14. Duan XX, Feng H, Ouyang JT. Uniformity of a dielectric barrier glow discharge: Experiments and two-dimensional modeling. Plasma Sourc Sci. Technol. (2012) 21:015008. doi:10.1088/0963-0252/21/1/015008
15. Guikema J, Miller N, Niehof J, Klein M, Walhout M. Spontaneous pattern formation in an effectively one-dimensional dielectric-barrier discharge system. Phys Rev Letts (2000) 85(18):3817–20. doi:10.1103/physrevlett.85.3817
16. Wang YH, Shi H, Sun JZ, Wang DZ. Period-two discharge characteristics in argon atmospheric dielectric-barrier discharges. Phys.Plasmas. (2009) 16:063507. doi:10.1063/1.3155447
17. Shang WL, Wang DZ, Zhang YT. Radio frequency atmospheric pressure glow discharge in alpha and gamma modes between two coaxial electrodes. Phys Plasmas (2008) 15:093530. doi:10.1063/1.2977767
18. Liu Y, de Vries HW, Elam F, Zoethout E, Starostin S, Vries HD. Atmospheric-pressure silica-like thin film deposition using 200 kHz/13.56 MHz dual frequency excitation. J Phys D: Appl Phys (2019) 52:355201. doi:10.1088/1361-6463/ab269b
19. Ohya Y, Ishikawa K, Komuro T, Yamaguchi T, Takeda K, Kondo H, et al. Spatial profiles of interelectrode electron density in direct current superposed dual-frequency capacitively coupled plasmas. J Phys D: Appl Phys (2017) 50(15):155201. doi:10.1088/1361-6463/aa60f7
20. Wang YN, Li XS, Wang L, Jin Y, Zhang YH, Liu Y. Effects of HF frequency on plasma characteristics in dual-frequency helium discharge at atmospheric pressure by fluid modeling. Plasma Sourc Sci. Technol (2018) 20(11):115402. doi:10.1088/2058-6272/aac71e
21. Liuvan’t Veer YK, Peeters FJJ, Mihailova DB, van Dijk J, Starostin SA, van de Sanden MCM, et al. Numerical simulation of atmospheric-pressure 200 kHz/13.56 MHz dual-frequency dielectric barrier discharges. Plasma Sourc Sci. Technol. (2018) 27:105016. doi:10.1088/1361-6595/aae555
22. Liu Y, Starostin SA, Peeters FJJ, van de Sanden MCM, de Vries HW. Atmospheric-pressure diffuse dielectric barrier discharges in Ar/O2gas mixture using 200 kHz/13.56 MHz dual frequency excitation. J Phys D: Appl Phys (2018) 51:114002. doi:10.1088/1361-6463/aaac73
23. Bazinette R, Sadeghi N, Massines F. Dual frequency DBD: Influence of the amplitude and the frequency of applied voltages on glow, Townsend and radiofrequency DBDs. Plasma Sourc Sci. Technol. (2020) 29(9):095010. doi:10.1088/1361-6595/ab8686
24. Magnan R, Hagelaar G, Chaker M, Massines F. Atmospheric pressure dual RF-LF frequency discharge: Influence of LF voltage amplitude on the RF discharge behavior. Plasma Sourc Sci. Technol. (2020) 29:035009. doi:10.1088/1361-6595/ab4cfe
25. Magnan R, Hagelaar G, Chaker M, Massines F. Atmospheric pressure dual RF–LF frequency discharge: Transition from α to α – γ -mode. Plasma Sourc Sci. Technol. (2021) 30:015010. doi:10.1088/1361-6595/abd2ce
26. Zhang ZL, Nie QY, Wang ZB, Gao XT, Kong FR, Sun YF, et al. Numerical studies of independent control of electron density and gas temperature via nonlinear coupling in dual-frequency atmospheric pressure dielectric barrier discharge plasmas. Plasmas Phys (2016) 23:073501. doi:10.1063/1.4954647
27. Zhang ZL, Lim JWM, Nie QY, Zhang XN, Jiang BH. Electron heating and mode transition in dual frequency atmospheric pressure argon dielectric barrier discharge. AIP Adv (2017) 7:105313. doi:10.1063/1.5000044
28. Zhang Z, Nie Q, Wang Z, Lim JWM. Selective modulation of plasma parameters in an atmospheric dielectric barrier discharge driven by sawtooth-type tailored voltage waveforms. Phys Plasmas (2020) 27:063519. doi:10.1063/5.0006078
29. Zhang ZL, Nie QY, Zhang XN, Wang ZB, Kong FR, Jiang BH, et al. Ionization asymmetry effects on the properties modulation of atmospheric pressure dielectric barrier discharge sustained by tailored voltage waveforms. Phys Plasmas (2018) 25:043502. doi:10.1063/1.5020216
30. Sun Y, Zhang Z, Lim JWM. Enhancement of discharge properties of atmospheric pressure plasma systems through trace radio-frequency oscillation control. Plasma Sourc Sci. Technol. (2021) 30:075018. doi:10.1088/1361-6595/abfd94
31.Plasimo Plasma simulation and modelling. (2021). Available at: https://plasimo.phys.tue.nl/.
32.lxcat.net. Data. (2020). Available at: https://fr.lxcat.net/data/set_type.php.
33. Mihailova DB. Sputtering hollow cathode discharges designed for laser applications. Netherlands: Eindhoven University of Technology (2010).
34. Ellis HW, Pai RY, Mcdaniel EW, Viehland LA. Transport properties of gaseous ions over a wide energy range. Data Nucl Data Tables (1976) 17:177–210. doi:10.1016/0092-640x(76)90001-2
35. Gregório J, Leprince P, Boisse-Laporte C, Alves LL. Self-consistent modelling of atmospheric micro-plasmas produced by a microwave source. Plasma Sourc Sci. Technol. (2012) 21:015013. doi:10.1088/0963-0252/21/1/015013
36. Emmons DJ, Weeks DE, Eshel B, Perram GP. Metastable Ar(1s5) density dependence on pressure and argon-helium mixture in a high pressure radio frequency dielectric barrier discharge. J Appl Phys (2018) 123:043304. doi:10.1063/1.5009337
37. Hagelaar GJM, Pitchford LC. Solving the Boltzmann equation to obtain electron transport coefficients and rate coefficients for fluid models. Plasma Sourc Sci. Technol. (2005) 14:722–33. doi:10.1088/0963-0252/14/4/011
38. Bogaerts A, Gijbels R. Role of Ar2+ and Ar2+ ions in a direct current argon glow discharge: A numerical description. J Appl Phys (1999) 86:4124–33. doi:10.1063/1.371337
39. Bultel A, van Ootegem B, Bourdon A, Vervisch P. Influence ofAr2+in an argon collisional-radiative model. Phys Rev E (2002) 65:046406. doi:10.1103/physreve.65.046406
40. Sobota A, Manders F, Van Veldhuizen EM, Van Dijk J, Haverlag M. The role of metastables in the formation of an argon discharge in a two-pin geometry. IEEE Trans Plasma Sci (2010) 38:2289–99. doi:10.1109/tps.2010.2056934
41. Morrow R, Sato N. N. The discharge current induced by the motion of charged particles in time-dependent electric fields; Sato's equation extended. J Phys D: Appl Phys (1999) 32(5):L20–2. doi:10.1088/0022-3727/32/5/005
Keywords: dielectric barrier discharge, dual-frequency discharge, atmospheric pressure non-equilibrium plasma, electron dynamic, plasma parameter control
Citation: Yu Y, Zhang Z, Nie Q, Zeng J, Zhao Z and Wang X (2023) Electron dynamics and metastable species generation in atmospheric pressure non-equilibrium plasmas controlled by dual LF–RF frequency discharges. Front. Phys. 11:1137250. doi: 10.3389/fphy.2023.1137250
Received: 04 January 2023; Accepted: 27 March 2023;
Published: 12 April 2023.
Edited by:
Peter J. Bruggeman, University of Minnesota Twin Cities, United StatesReviewed by:
Mourad Djebli, Université des Sciences et de la Technologie Houari Boumediene (USTHB), AlgeriaSebastian Dahle, University of Ljubljana, Slovenia
Copyright © 2023 Yu, Zhang, Nie, Zeng, Zhao and Wang. This is an open-access article distributed under the terms of the Creative Commons Attribution License (CC BY). The use, distribution or reproduction in other forums is permitted, provided the original author(s) and the copyright owner(s) are credited and that the original publication in this journal is cited, in accordance with accepted academic practice. No use, distribution or reproduction is permitted which does not comply with these terms.
*Correspondence: Zhonglin Zhang, zhang_zl@hit.edu.cn
†ORCID: Zhonglin Zhang, orcid.org/0000-0002-3548-8718; Qiuyue Nie, orcid.org/0000-0001-8895-8616