
Frequency-Tuned Porous Polyethylene Glycol Films Obtained in Atmospheric-Pressure Dielectric Barrier Discharge (DBD) Plasma


1
“Petru Poni” Institute of Macromolecular Chemistry, 41 A Gr. Ghica Voda Alley, 700487 Iasi, Romania
2
Institut Européen des Membranes, Adaptive Supramolecular, Nanosystems Group, University of Montpellier, ENSCM, CNRS, 34095 Montpellier, France
*
Authors to whom correspondence should be addressed.
Appl. Sci. 2023, 13(3), 1785; https://doi.org/10.3390/app13031785
Submission received: 12 December 2022
/
Revised: 27 January 2023
/
Accepted: 28 January 2023
/
Published: 30 January 2023
(This article belongs to the Special Issue Recent Advances in Atmospheric-Pressure Plasma Technology, 2nd Volume)
Abstract
:This study focuses on the fabrication of plasma-polymerized polyethylene glycol (pp-PEG) with porous morphology in a pulsed dielectric barrier discharge (DBD) plasma under atmospheric pressure. The signal frequency that modulates the plasma discharge was found to have a major influence on the pp-PEG film morphology. The recorded discharge current–voltage characteristic allowed us to establish a homogeneous regime of the DBD plasma operated in helium gas flow upon the frequency range 2–10 kHz. The as-prepared pp-PEG films were characterized by the Fourier transform infrared spectroscopy (FTIR), scanning electron microscopy (SEM) and liquid-phase chromatography (HPLC) techniques. The performed analysis revealed that as the discharge frequency increases, the morphology of the obtained films becomes porous due to the plasma-induced stronger monomer fragmentation. To gain knowledge about the plasma species and the interaction processes that impact the film morphology, optical emission spectroscopy (OES) and intensified charge-coupled device (ICCD) fast imaging technique were applied. The determined vibrational () and rotational () temperatures exhibit a decrease with the introduction of monomer vapors into the discharge gap. For instance, drops from approximately 475 K to 350 K, and falls from 2850 K to 2650 K for a monomer vapor injection rate of 16 µL/min. This was attributed to the energy losses of the plasma-generated particles, as the inelastic collisions augment with the injection of a monomer. Concurrently with the change in temperature, the discharge current varies significantly for the investigated frequency range and exhibits a drop at high frequencies. This discharge current drop was explained by an enhancement of the recombination rate of charged particles and seems to confirm the prevalence of a plasma-induced monomer fragmentation process at high frequencies.
1. Introduction
Polymer deposition is a current hot topic in research, with numerous applications in everyday life such as biomedical, environmental, packaging or corrosion-protective coatings [1]. Different techniques are used for coating material surfaces with functional organic films, such as direct chemical grafting, ultraviolet-induced polymerization, self-assembled monolayers or plasma-enhanced chemical vapor deposition (PECVD) [2,3,4,5]. Commonly referred to as plasma polymerization, PECVD has attracted considerable attention from both academic and industrial research [6]. Unlike conventional techniques [7], plasma-polymerized films show distinct features. The resulted polymer-like films are usually branched, highly cross-linked, insoluble and pinhole-free and adhere well to most substrates [1,8]. Furthermore, plasma polymerization does not involve the use of solvents or catalysts, and it is scalable and independent of the nature of the substrate. These features result from a variety of fundamental events occurring in the plasma volume as well as at the plasma–material interface and are triggered by plasma characteristics such as particle density, collision frequency, particle mean kinetic energy and chemical active species. In addition to the intrinsic polymer properties, the plasma parameters can be adjusted to alter the polymer surface as well, through a variety of procedures such as etching, functionalization and cross linking [1].
Among the various plasma sources used in PECVD, the dielectric barrier discharge (DBD) is one of the most versatile and simple to implement. Typically, the polymer precursor is introduced into the discharge region as soluble polymer aerosols or monomer vapors, which will then be activated and fragmented upon passing through the plasma discharge area, generating the film-forming species. The strategy of using the vapors of some macromolecules (aerosols) proved effective in obtaining highly adherent and pinhole-free thin films to protect the substrate against environmental influences. For instance, the injection of poly(ethylene glycol)–poly(vinyl alcohol) copolymer aerosols in a DBD was used for the deposition of ultrathin polymer films (20 nm in thickness) aiming at the fabrication of polyolefin adhesion-promoting layers [9]. Conversely, by introducing monomer vapors into a DBD plasma, the fragmentation and random recombination of the generated species, in conjunction with the processes performed on the substrate (e.g., UV irradiation, well-known to enhance radical polymerization, and ion bombardment of the growing film) [10], enhance cross linking and, as a result, the stability of the obtained plasma-polymerized film [11]. However, the unreasonable increase in the power delivered to the discharge can result in excessive monomer fragmentation, which in turn, through the activation and random recombination of the generated species, leads to the growth of a plasma-polymerized film whose composition is not representative of the starting monomer and even to the deposition of inorganic films [12]. As a result, DBD plasma polymerization entails a complex panel of physical and chemical processes, starting with the fragmentation of the injected precursors (monomers or some macromolecules in aerosol form) caused by collisions with energetic particles, then random recombination and again fragmentation, diffusion and finally condensation to substrate [13].
Plasma-polymerized (pp-PEG) films are the most widely used group of materials that present a hydrophilic character with remarkable resistance to biofouling [14,15]. PEG was accepted for clinical studies and in vivo applications due to its hydrophilicity, immunogenicity and non-toxicity [16,17,18,19]. The reduction in protein and cell adhesion was tested for pp-PEG films obtained on different substrates. Although these features can be further enhanced by increasing their surface area, its wide spread in applications depends on the development of new techniques to obtain pp-PEG films with a porous morphology. The currently employed technique for the deposition of polymer-like films with porous morphology, regardless of the polymer type, is the use of a porous structured template [20].
In this work, pp-PEG films with porous morphology were obtained in a pulsed DBD plasma at atmospheric pressure on a template-free glass substrate. The effect of the discharge frequency on the fabricated polymer-like films was investigated. The properties of the obtained pp-PEG films were explored by means of specific characterization techniques, and correlation with plasma parameters was pursued.
2. Experimental Details
2.1. Materials and Methods
The pulsed DBD plasma was generated at atmospheric pressure in a chemical reactor with a plane-parallel configuration as presented in Figure 1. High-voltage monopolar pulses were applied between two electrodes with circular geometry (30 mm in diameter) placed 5 mm from each other. A 1 mm thick glass layer covering both electrodes was used as dielectric barrier. A similar DBD configuration was employed in our earlier published research [19,21,22].
In a DBD glow operational mode, two characteristic current peaks (Figure 2a) are associated with each applied voltage pulse to describe the occurrence of the primary (1ry) and secondary (2ry) plasma discharges [23,24,25]. The experiments were made at room temperature in a laminar flowing of high-purity helium gas (99.999%), with a flow rate of 3 L/min. No preliminary vacuum pumping was used. Prior to the experiment, the working gas was blown into the reactor chamber for 5 min to remove air impurities. Then, the ethylene glycol monomer vapors were introduced at a consumption rate of 16 µL/min by using an additional helium flow rate of 0.5 L/min for monomer bubbling. The ethylene glycol monomer of 99.0% purity was purchased from Merck-Chemical.
The amplitude of the applied discharge pulse was maintained constant at 4.5 kV, while the repetition rate was varied between 2 kHz and 10 kHz. All studies were conducted with a constant polymerization time of 10 min. The asprepared pp-PEG films were characterized by the Fourier transform infrared spectroscopy (FTIR) (Nicolet Nexus FT-IR spectrometer, Thermo Fisher Scientific, Waltham, MA, USA), scanning electron microscopy (SEM) (Quanta 200 Scanning Electron Microscope FEI Company, Hillsboro, OR, USA) and liquid-phase chromatography (HPLC) techniques (Waters 2695 separation module, Waters Micromass, Quattro Micro mass spectrometer equipped with ESI-Electrospray Ionization, Wythenshawe, Manchester, UK).
Intensified charge-coupled device (ICCD) fast imaging technique is very often used to study transitory processes that occur in plasma laboratory sources [26,27,28]. By means of this method, the evolution of the global plasma emission was recorded (Figure 2b). Each image was normalized to the recorded maximum intensity emitted by the plasma to observe the evolution of the plasma along the current pulse width. The measurements were done with ICCD camera produced by Hamamatsu Photonics, Hamamatsu, Japan (C8484-05G) that allows optical measurements in the spectral range between 300 and 1000 nm, with a maximum sensitivity between 350 and 800 nm. The DBD plasma was monitored during 25 μs pulse discharge length by using an additional rectangular signal of 30 ns width. This signal was triggered by the discharge current pulse, either the positive rising edge or the negative dropping edge, depending on the plasma region that is being investigated. The applied signal forces the camera to remain open only for the duration of the gate. By moving the gate at a different delay from the fixed discharge current peaks, either compared to that of the positive or negative current peaks, 30 ns gated ICCD fast images were recorded during the primary or secondary discharge, respectively.
2.2. Plasma Temperature Calculation
The emission of DBD plasma was spectrally resolved by using optical emission spectroscopy (OES) technique. A high-resolution monochromator (Triax 550, Horiba Jobin Yvon, Palaiseau, France) allowed us to record atomic and molecular emission features of the excited plasma species in the investigated discharge frequency range. The recorded vibrational and rotational spectra were used for plasma temperature calculation. By using the molecular nitrogen spectra, the vibration temperature () was determined. The integrated intensity of the vibrational bands represented in semi-logarithmic coordinates (Boltzmann diagram) as a function of the upper energy level is given by [29,30]
where c is the speed of light in vacuum, is Einstein coefficient for the considered transition, is energy of the final level, and is the energy of the level for v′ = 0. The relationship between the slope and the vibrational temperature is given by the following equation:
The intensity of the assigned rotational features of the N2+ ion bands (band head at 391.44 nm) represented in semi-logarithmic coordinates as a function of the rotation quantum number (equation below) was used for rotational temperature () calculation [29,30].
The relationship between the slope and the rotational temperature is given by the following equation:
where h is Planck’s constant, c is the speed of light in vacuum, is Boltzmann’s constant, and B is the rotational constant (B = 3 cm−1).
3. Results and Discussion
Since in a typical glow operational mode DBD, the discharge starts and ends on each half-cycle of the applied voltage pulse, the rate of radical generation will not be constant but rather in pulses. Therefore, within the polymerization process, the time-averaged concentration of the plasma species that contribute to the polymer film growth will depend on the discharge frequency and kinetics of the generated species [31,32]. To establish how the properties of the obtained pp-PEG films rely on the frequency of the applied signal and on the dynamics of the created species, both DBD plasma characteristics and the resulting polymerized films were examined.
3.1. Plasma Characterization
A typical glow operational mode of a DBD plasma is described by two current characteristic peaks: one positive associated with the occurrence of a primary (1ry) discharge and one negative linked to the generation of a secondary (2ry) discharge (Figure 2a). The discharge current intensity was recorded within the frequency range of 2–10 kHz of an atmospheric-pressure DBD operating in He and a mixture of He and ethylene glycol (EG) vapors. In Figure 3, the variations of the current intensity peak with frequency for both cases are presented. The positive current peak, linked to the 1ry structure, exhibits an increase until a value of 6 kHz is reached (Figure 3a). Subsequent increases in frequency result in a stagnation region of the dependence if the DBD operates only in He (see the red curve in Figure 3a) or lead to a slow decreasing part if the monomer vapors are added (see the black curve in Figure 3a). The initial increase in the current could be explained by an enhancement of the ionization processes occurring near the high voltage (HV) electrode during the first half-cycle of the discharge pulse.
As the time gap between individual voltage pulses decreases, the charged particles (ions and electrons) that reach the surface of the electrodes diminish, especially in the case when the monomer vapors are added. This behavior can be explained by an augmentation of the recombination rate of the charged particles at high frequencies, when a variety of molecular and atomic species are very likely to be produced through a plasma-induced monomer fragmentation process [33]. The reversal polarity of the electrodes in the second half of the discharge cycle reveals a mirror evolution of the current associated with the 2ry plasma discharge (Figure 3b).
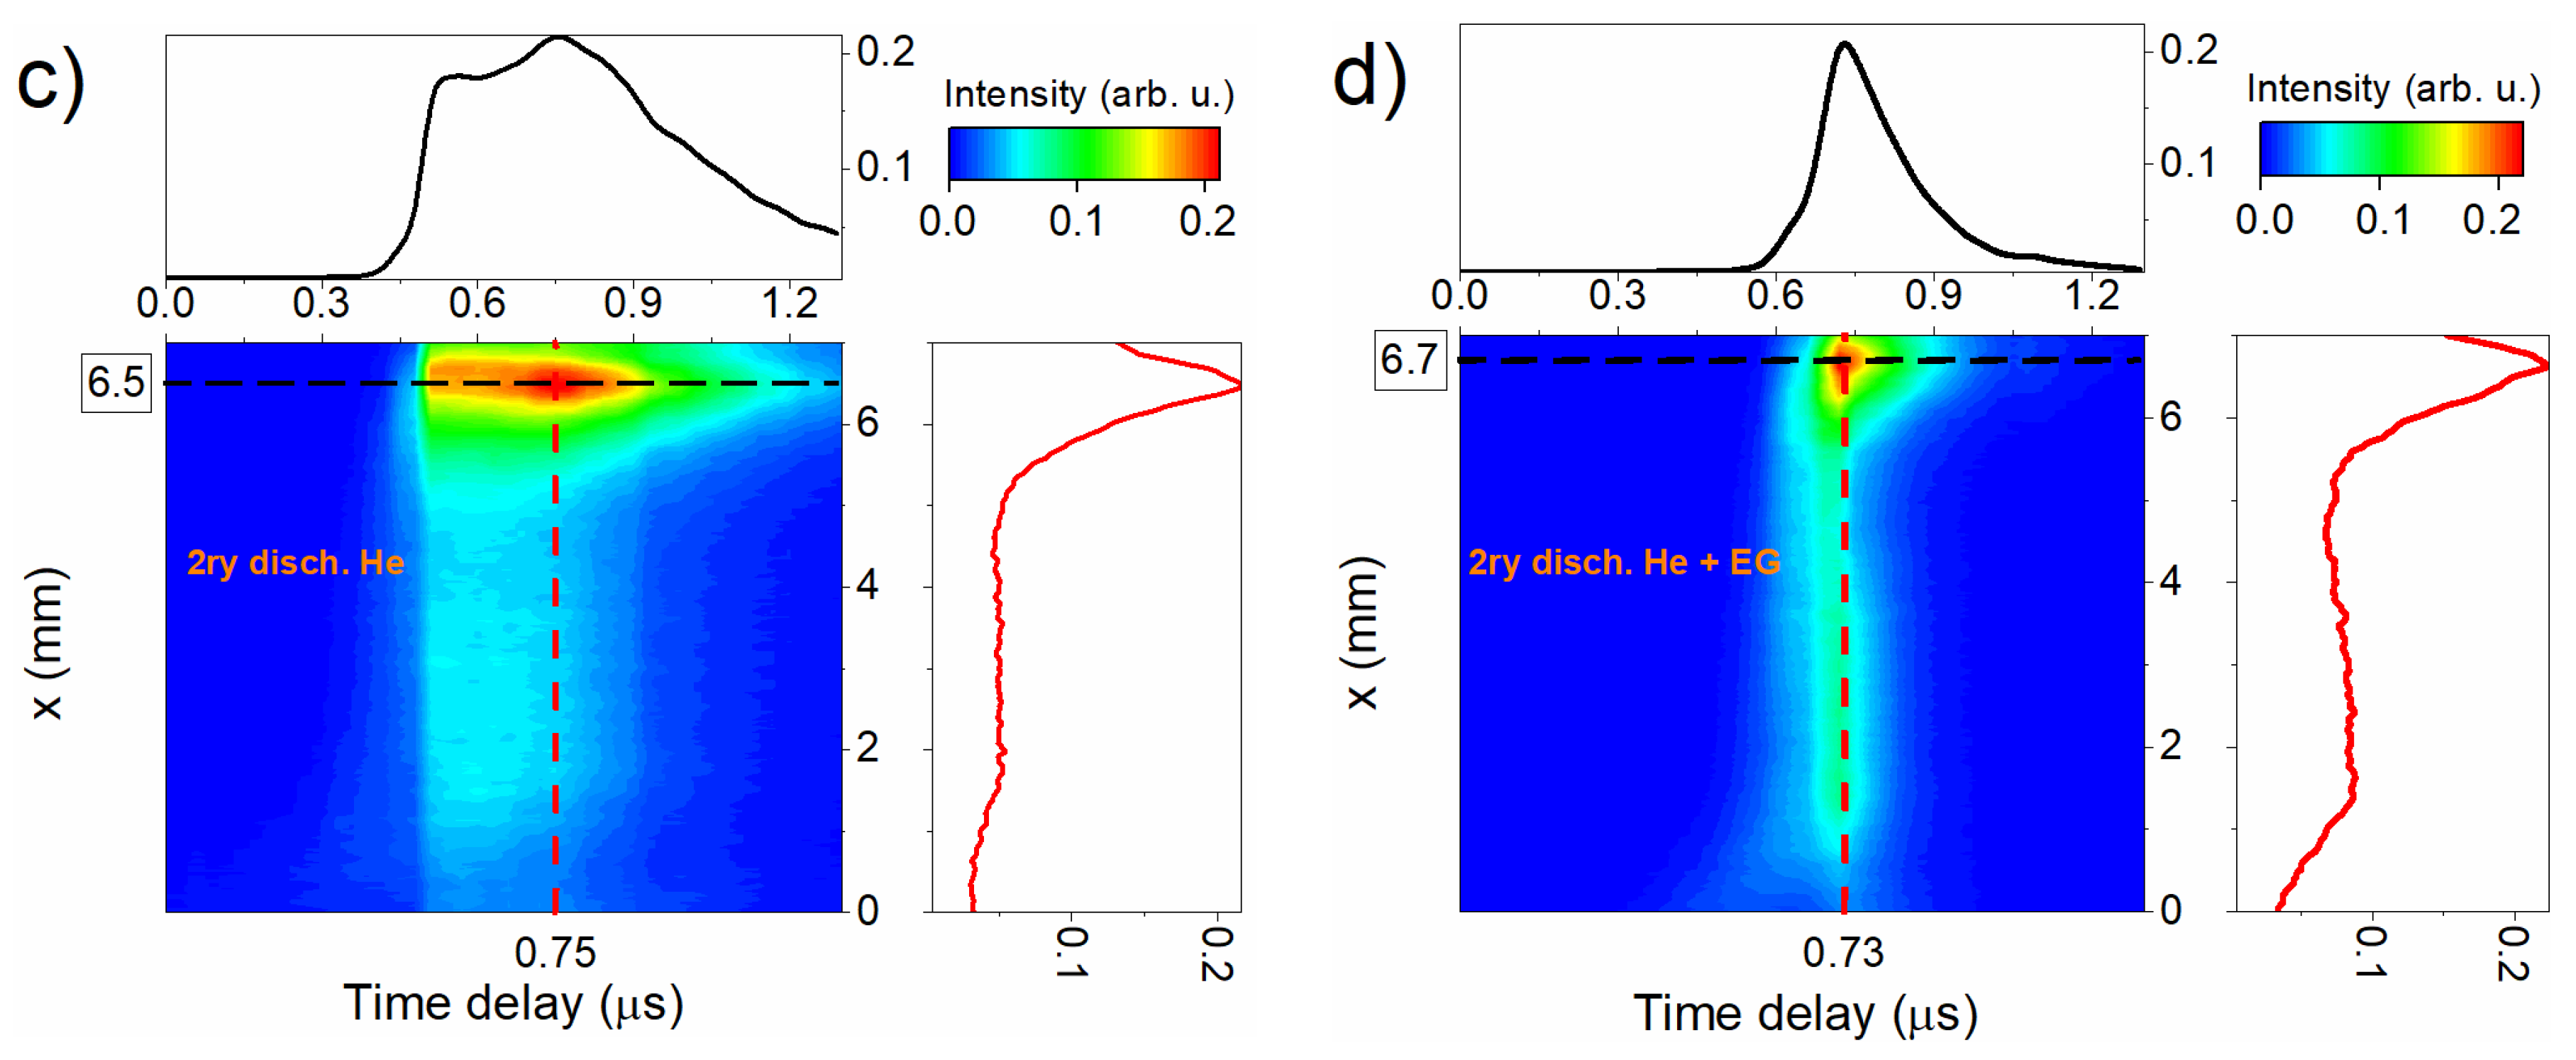
To investigate the dynamics of the two plasma regions, ICCD fast imaging measurements were performed. In Figure 2b are presented spectrally integrated ICCD fast images of the 1ry and 2ry plasmas at different delays from the positive and negative discharge current peaks, respectively. Taking the axial cross-section of each image with the corresponding time sequences, the spatio-temporal evolution of the 1ry and 2ry plasmas is obtained (Figure 4). The spatio-temporal profiles corresponding to the first half-cycle of the DBD (i.e., 1ry plasma) operated in He shows the propagation of this region toward the ground (GR) electrode. The maximum emission of this plasma structure is located at 0.4 mm from the HV electrode and at 0.44 µs from the positive current peak reference (Figure 4a). With the introduction of ethylene glycol vapors into the discharge gap, the emission intensity of this region considerably diminishes, with no significant changes in the emission maximum (Figure 4b).
Due to the “reversal” role of the electrodes acting during the second half-cycle of the applied discharge pulse [34,35], a 2ry plasma appears next to the GR electrode (at 0.5 mm) that propagates backward to the 1ry plasma region (Figure 4c). Unlike the 1ry plasma structure, the total intensity emitted by this region is less affected by the monomer vapor’s introduction (Figure 4d), suggesting that the main processes influencing the properties of the polymerized film take place near the HV electrode.
To get deeper insight into the kinetics of the plasma species, time-integrated OES measurements were performed within the investigated frequency range. Although most of the plasma optical signal intensity comes from the discharge region next to the HV electrode, the spectral measurements were performed by integrating the signal over the entire discharge space.
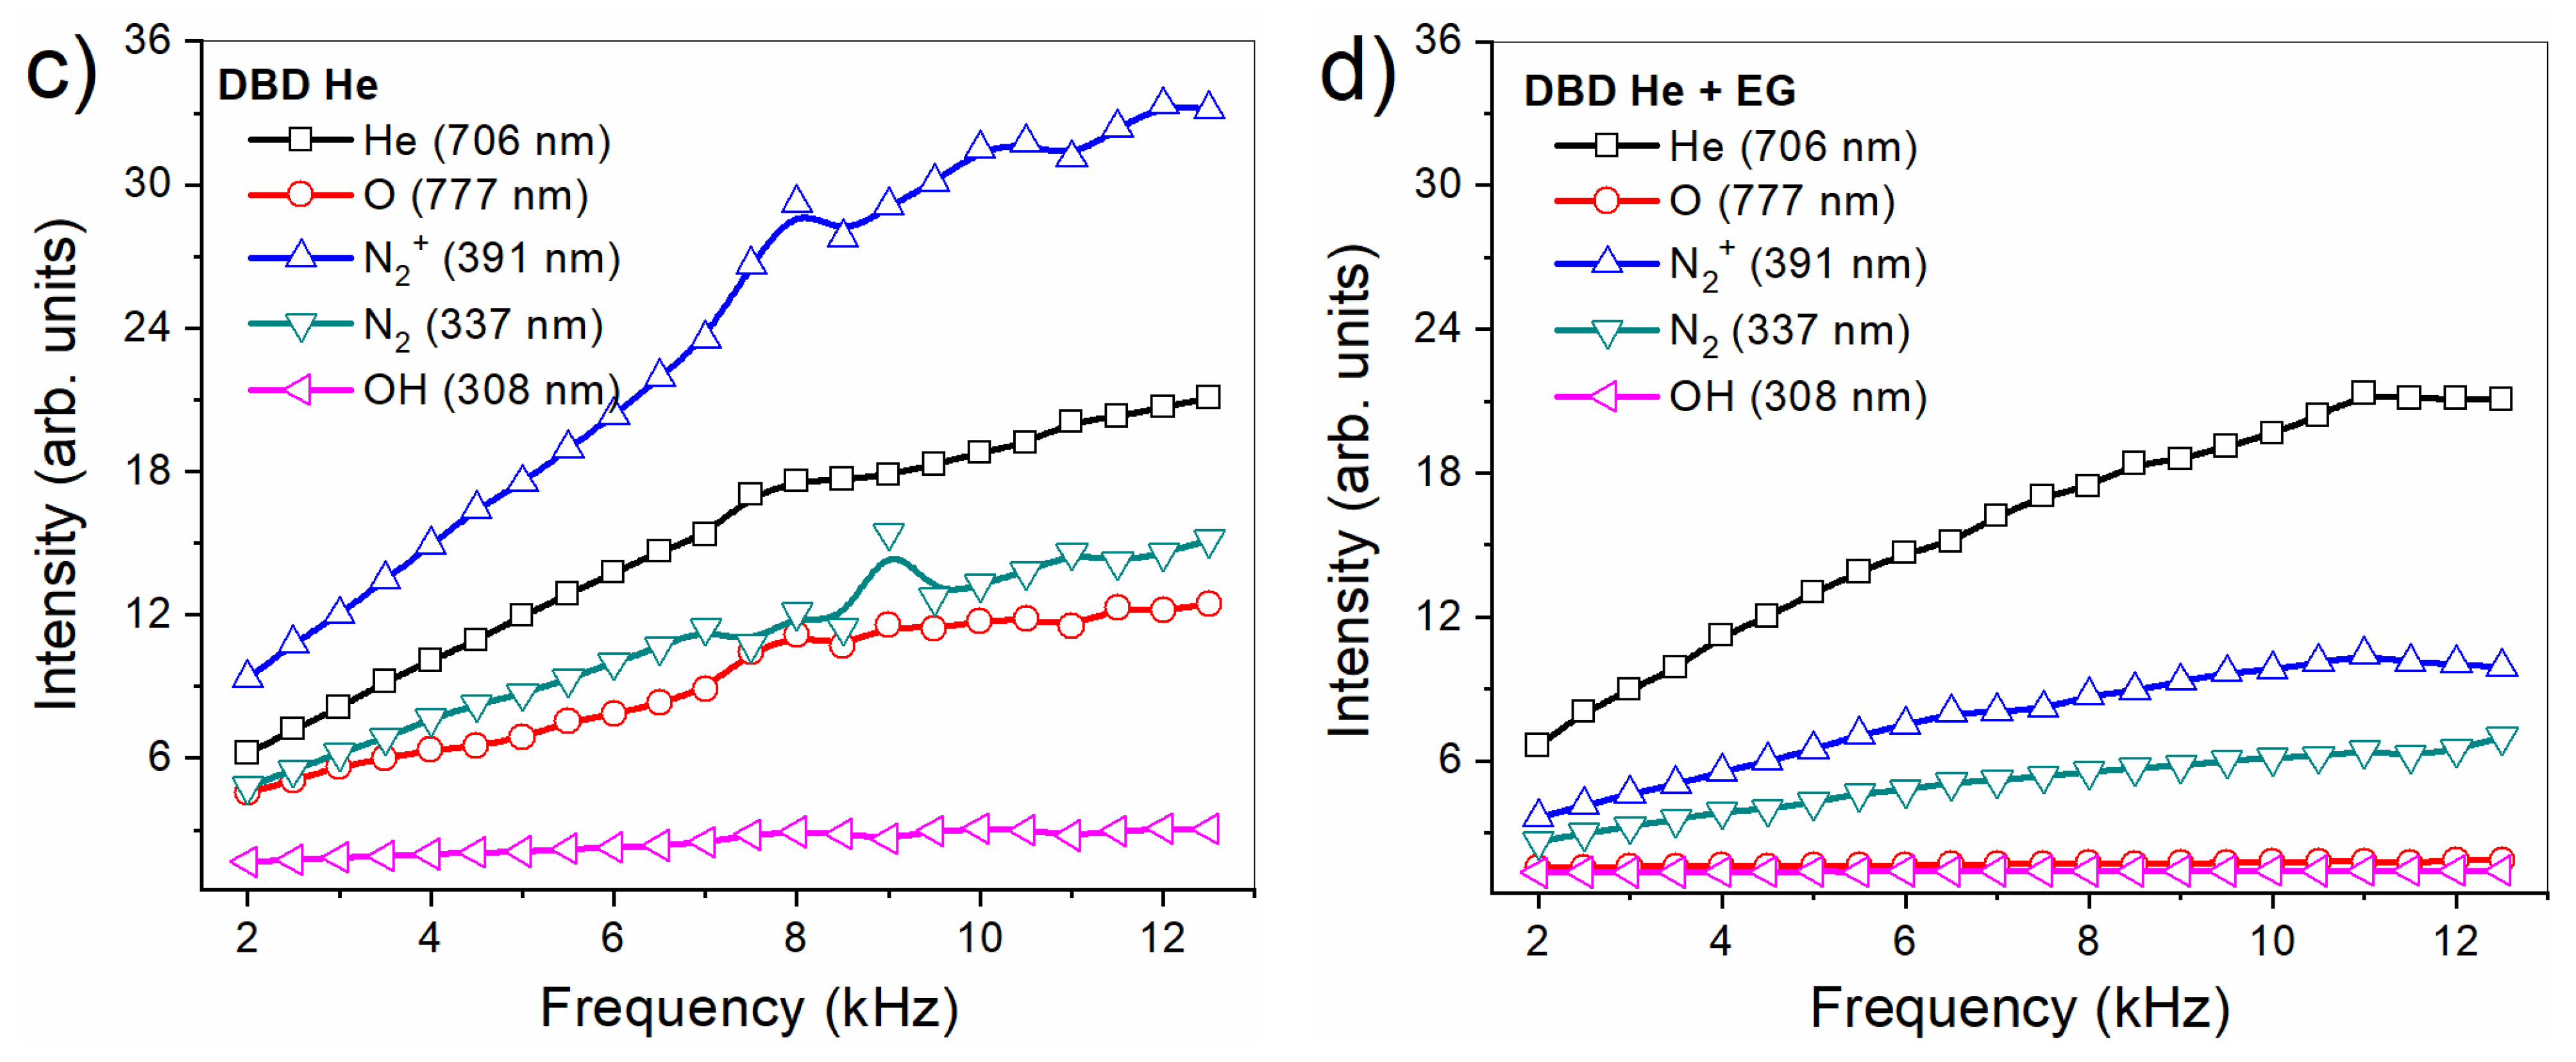
Wide emission spectra of the DBD plasma generated at different applied voltage frequencies were recorded for both working gas mixtures, He and He with ethylene glycol vapors (Figure 5a). From the assigned emission features, it can be noticed that atomic (such as He and oxygen spectral lines) and molecular plasma species (such as OH radicals, and ) are constituted in both DBD working environments. The spectral region showing the neutral and ionic molecular nitrogen species and involved transitions [35] is presented in Figure 5b. As expected, irrespective of the working gas composition, the intensities of all DBD plasma species increase monotonically with discharge frequency because more discharge pulses are caught during the gate width for which the optical signal was recorded. Instead, the intensities of the most representative plasma species plotted as a function of discharge frequency (Figure 5c,d) follow a drop trend with the addition of a monomer, except for the intensities of the He spectral lines that remain constant. A possible route for the formation of the excited species (i.e., and He) is electron impact excitation, while is created by Penning ionization. The preponderant ionization process changes to electron impact ionization when monomer vapors are introduced [29,36,37,38,39].
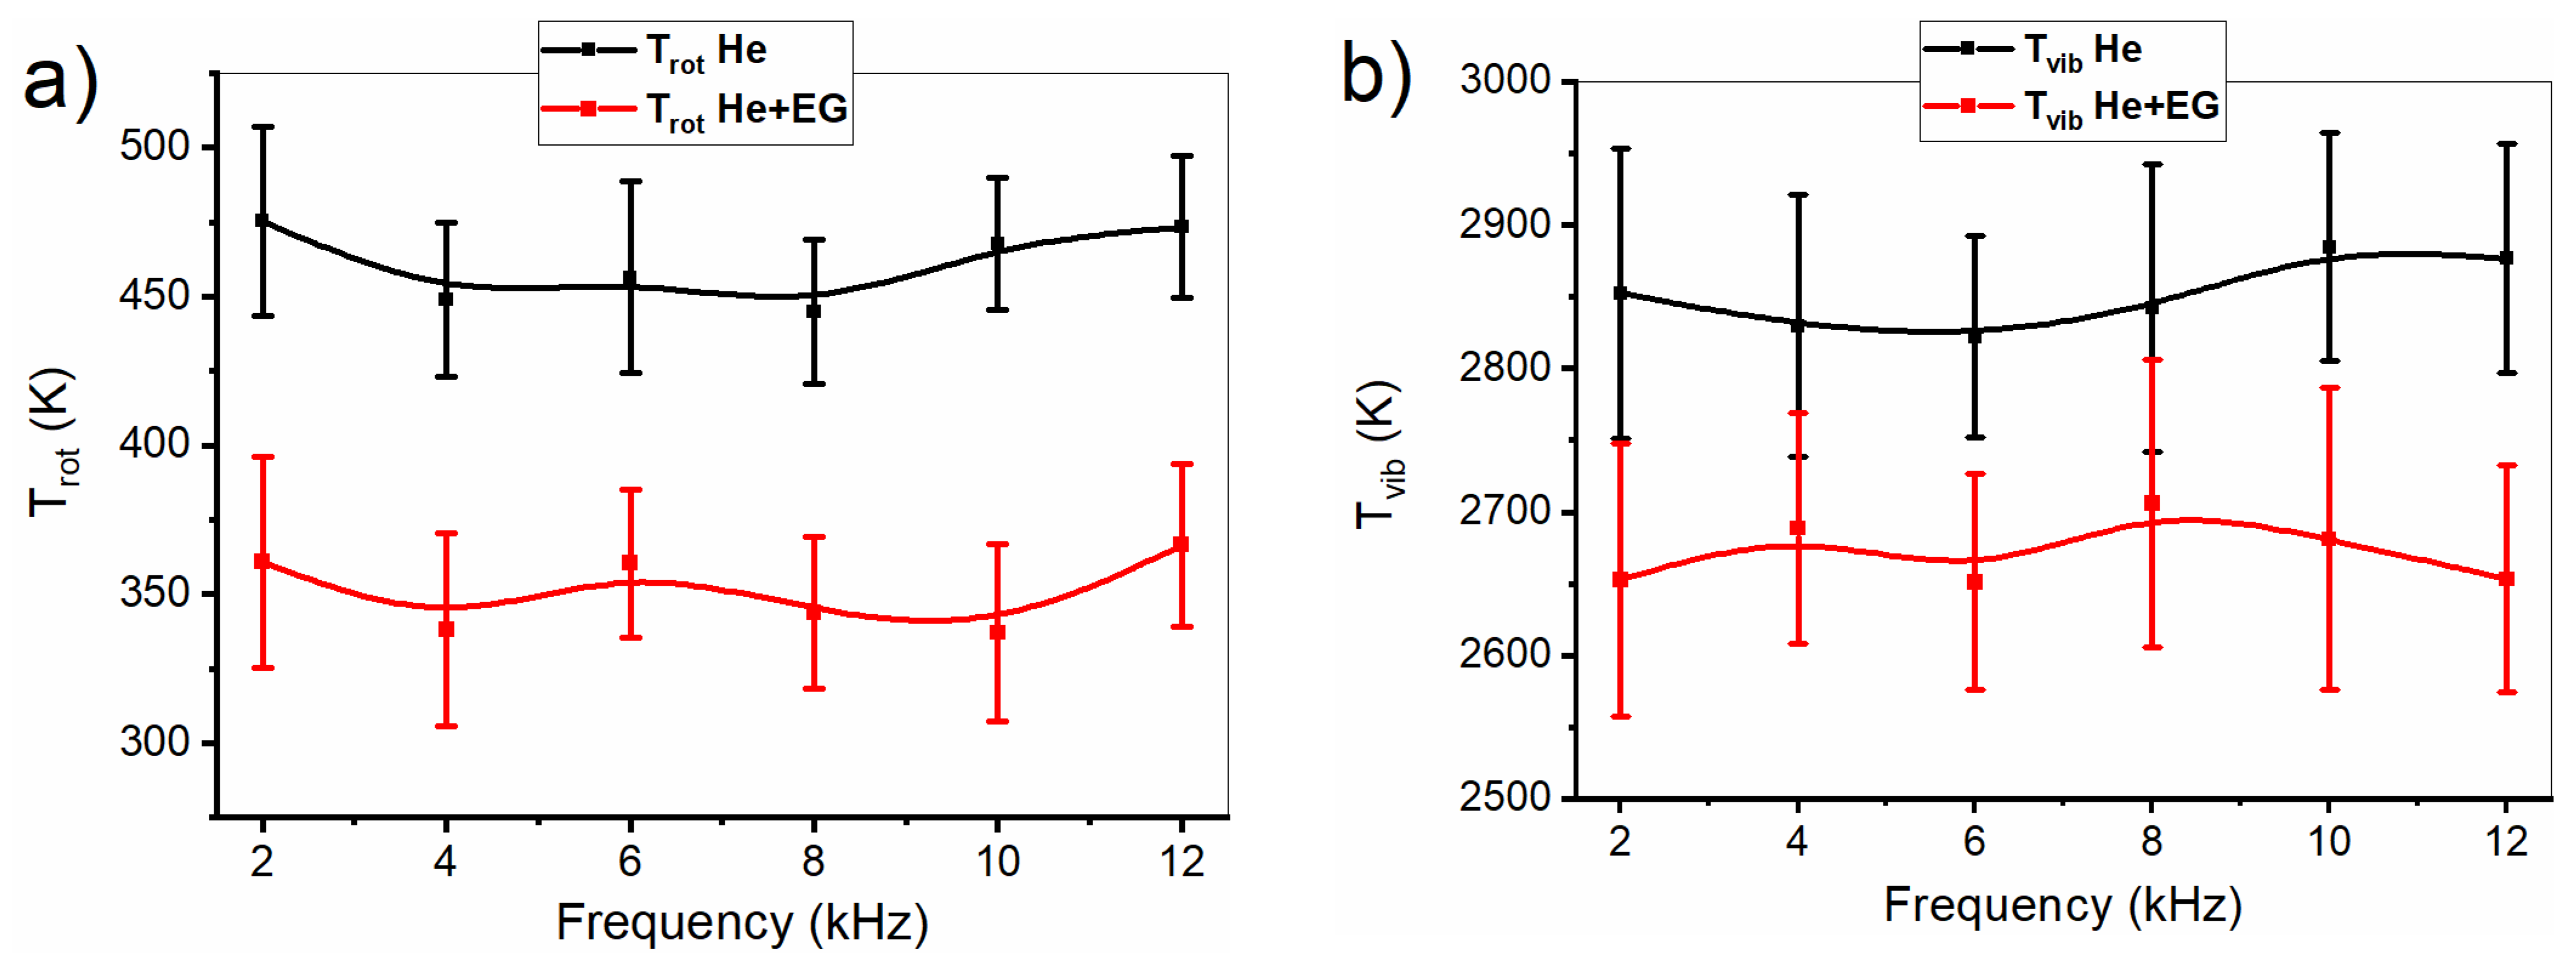
Following the procedure described in Section 2.2, the recorded vibrational and rotational spectra were used for plasma temperature calculation. Figure 6 depicts the frequency variations of rotational () and vibrational () temperatures. The maximum plasma temperature of 2850 K (0.25 eV) found for the DBD plasma operating in He is much lower than the energy required to break the C-C bond (3.59 eV) in the EG monomeric unit, preventing the monomer from completely decomposing. As the time gap between individual voltage pulses decreases, no significant effects are observed on the plasma temperature, although the previously presented variation of the discharge current with the frequency of the applied voltage (Figure 3) suggests a change in the plasma parameters. This insensitivity of the plasma temperature is probably due to the way the spectral measurements were performed, i.e., the optical signal was time-averaged over the used gate width. Instead, these dependencies clearly show that the introduction of monomer vapors into the discharge led to a decrease in and all over the investigated frequency range, along with the optical signal associated with almost all plasma species (except for the He-assigned spectral features; see corresponding curves presented in Figure 5c,d). For instance, the drops from approximately 475 K to 350 K (Figure 6a), and the falls from 2850 K to 2650 K (Figure 6b) with monomer vapor addition. These results agree with the previously presented data related to DBD current recordings (see the discussions related to Figure 3) when the introduction of monomer vapors causes at high frequencies a significant decrease in the discharge current. This drop in electrical current was attributed to an enhancement of the recombination rate of the charged particles coming from a plasma-induced monomer fragmentation process. Hence, the decrease in temperature that accompanies the electrical current drop could be attributed to the same process of plasma-induced monomer fragmentation, where the plasma-generated particles lose their energies as the inelastic collisions augment with the injection of monomer.
DBD plasma polymerization involves a complex series of fundamental chemical and physical processes that occur between the plasma-generated species (monomer fragmentation, random recombination and diffusion of generated fragments) and at the surface/plasma interface [13]. The chemistry in the gas phase related to the fragmentation mechanisms of the monomer is a key issue addressed in the literature, on the understanding of which depend the preservation of the functionality of the monomer or its complete degradation [40,41]. Previous research has revealed a mechanism for EG fragmentation by electronic impact, with a high probability of breaking the EG monomer skeleton at the C-Cσ and C-O covalent bonds and the subsequent formation of various types of radicals such as CH*, CH2*, C2H4*, C2H4OH*, CH2OH* and OH* [42]. Later, by recombination with neutral plasma species, these radicals can form larger molecular fragments and contribute to the growth of the pp-PEG film.
3.2. Pp-PEG Thin Film Characterization
The properties of fabricated pp-PEG films were explored by using specific investigation techniques, such as Fourier transform infrared spectroscopy (FTIR), scanning electron microscopy (SEM) and high-performance liquid chromatography (HPLC). To establish correlations with the results related to optical and electrical plasma characterization, the experimental conditions for producing pp-PEG films were similar to those used previously, i.e., atmospheric-pressure DBD working in a He/EG vapor mixture with the applied voltage covering the frequency range from 2 kHz to 20 kHz.
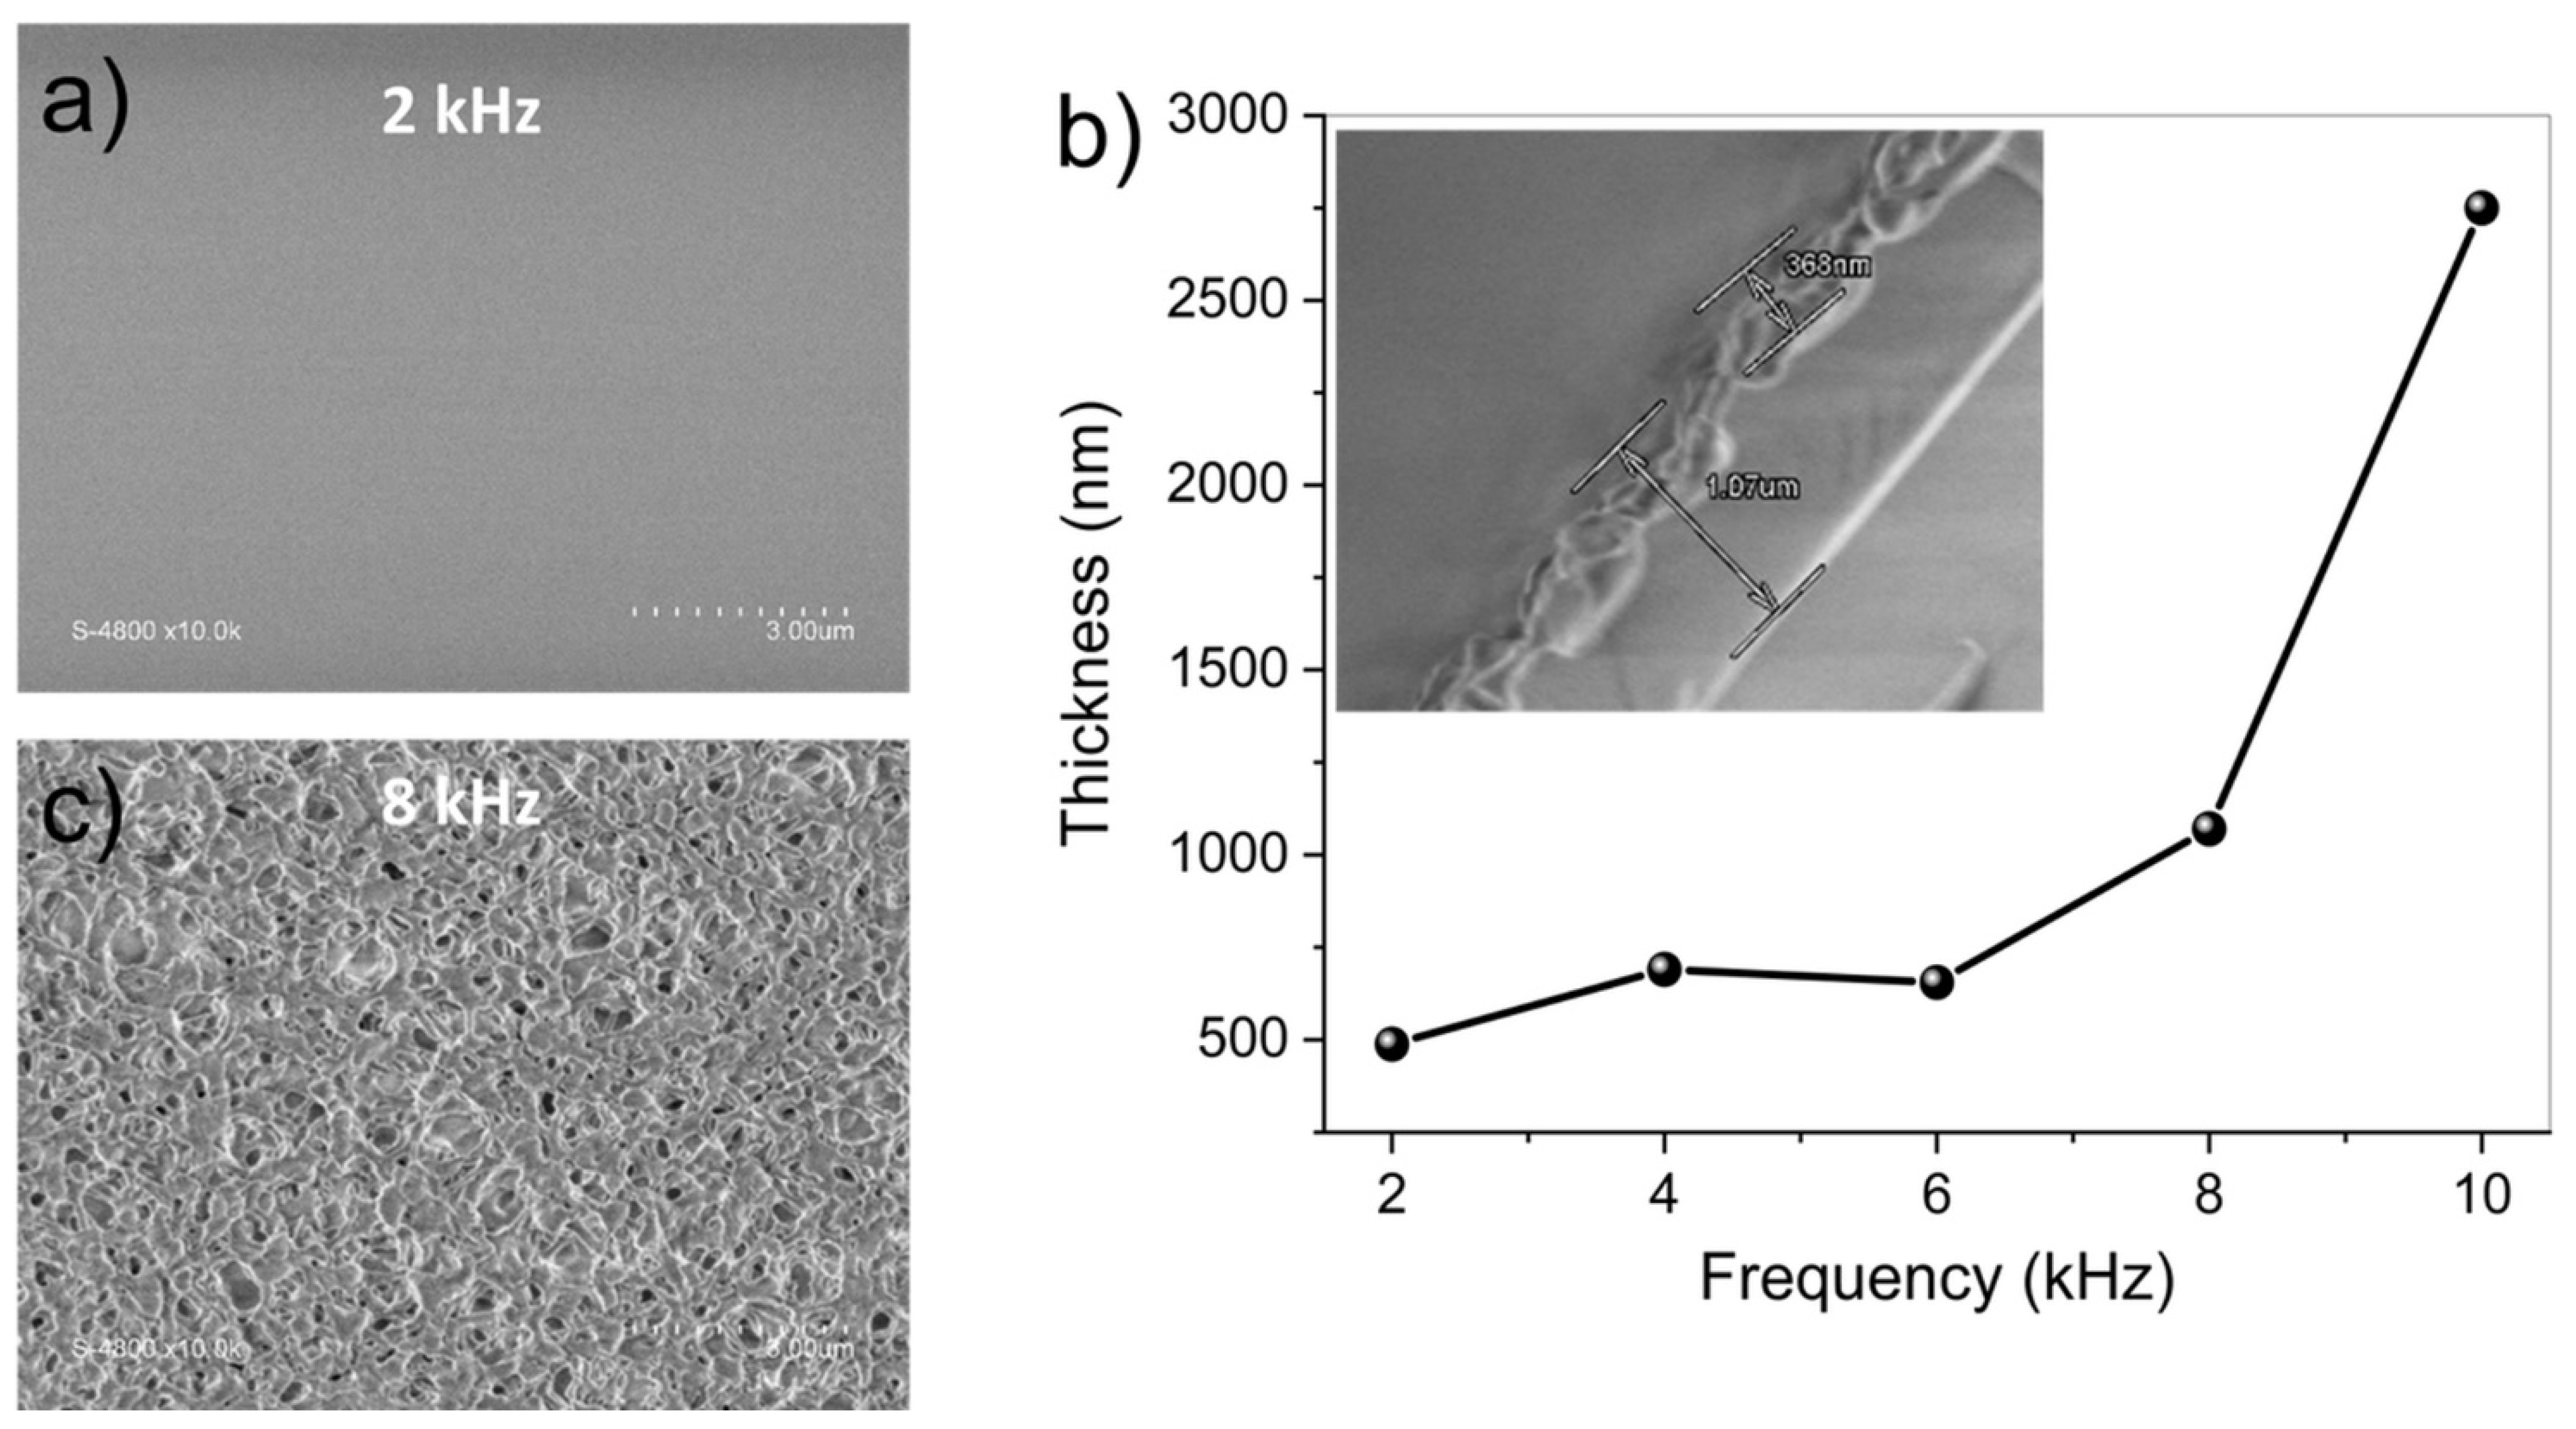
It was found that a key factor affecting the morphology of the obtained pp-PEG films is the signal frequency that modulates the plasma discharge. In a low-frequency domain (2–6 kHz), the morphology of polymerized films presents a smooth appearance, as can be observed from the SEM image presented in Figure 7a. For this frequency domain, the thickness determined by cross-section SEM analysis shows a slow increasing trend, with values ranging from 500 nm to 700 nm (Figure 7b). As the discharge frequency increases (6–10 kHz), the morphology of the pp-PEG film changes to porous, while the thickness exhibits a sharp increase up to 2.7 μm (Figure 7b). The inset in Figure 7b shows that a porous pp-PEG film with a thickness of 1.07 µm is grown for an applied discharge frequency of 8 kHz. Additionally, it can be observed that the film shows a porous appearance only toward the surface in a range of several hundred nanometers (i.e., 368 nm), while going deeper, the polymerized film presents a compact aspect. The porous morphology of the obtained pp-PEG films could be related to a plasma-induced monomer fragmentation that becomes stronger as the discharge frequency increases (Figure 7c). The increase in the porosity of the films with increasing frequency could be due to the accumulation of defects in the assembly of monomer fragments through a mechanism of random (poly)recombination. This leads to the formation of irregular polymer chains and structures at the macroscopic scale on the surface of the polymer [43].
To reveal the chemical groups present in the structure of the pp-PEG films, FTIR transmittance spectra were recorded for samples polymerized at different DBD discharge frequencies. IR spectra show the presence of various chemical groups with different vibration modes (Figure 8), such as -C-H in-plane deformation bending (873 cm−1), -C-O stretching (1046 cm−1 and 1299 cm−1), -CH2- symmetrical deformation (1456 cm−1 and 1419 cm−1), -C=O stretching (1714 cm−1) and -C-H bonds (2961 cm−1). The broad band ranging from 3600 cm−1 to 3200 cm−1 (Figure 8b) was assigned to various -OH vibration modes in the film volume [4]. All identified components are in good agreement with the starting ethylene glycol monomer whose IR spectrum was added for comparison. It can also be observed that the C=O bond appears only in plasma-polymerized films, reminiscent of the formation of -COOH groups on the surface. This is presumably due to the formation of chemical bonds between the plasma-generated fragments of the monomer and oxygen impurities during the atmospheric-pressure polymerization process. Moreover, for higher frequencies, the emerging of the band corresponding to -CH2- symmetrical deformation (1456 cm−1 and 1419 cm−1) clearly shows a stronger tendency of monomer fragmentation induced by the DBD plasma (Figure 8a). The increase in the -OH stretching vibrational band (located between 3100 and 3600 cm−1) can also be attributed to the prevalence of this plasma-induced monomer fragmentation process since, as a result, more hydroxyl groups are located on the terminal polymer chains (Figure 8b).
Within the HPLC studies, the mass spectra of the plasma-polymerized films were recorded by dissolving the obtained polymer in 2 mL of distilled water. By using a mass spectrometer coupled with a liquid-phase chromatograph, the mass spectra of pp-PEG films polymerized at 2, 6 and 10 kHz discharge frequencies were recorded (Figure 9).
Our results reveal a relative distance between two adjacent mass intensity peaks of about 24 m/z, while the literature gives a value for the mass-to-charge ratio corresponding to the EG monomer of 44. Hence, the distribution of mass intensity peaks between 500 and 900 m/z demonstrates that a minimum number of 21 and a maximum number of 38 repeating units of EG are included in the polymer chain. The spectra also show a distribution maximum located at 748 m/z, which corresponds to 31 EG units constituting the longest polymer chain. Moreover, comparing the spectra recorded for the sample obtained at different frequencies, it can be clearly noticed that the intensity of the peaks decreases as the rate of polymerization emphasized by the thickness measurements increases (see Figure 7b). This fall in intensity demonstrates an enhancement at high frequencies of the plasma-induced monomer fragmentation, which was previously found to be responsible for the porosity of pp-PEG films. All these results are consistent with those concerning the global plasma emission or the intensities of associated spectral features and the calculated vibrational or rotational plasma temperatures.
4. Conclusions
pp-PEG films with porous morphology were obtained in a pulsed DBD plasma at atmospheric pressure. It was found that a key factor affecting the morphology of the obtained pp-PEG films is the signal frequency that modulates the plasma discharge. To establish how the structural and morphological properties of the obtained pp-PEG films relate to the discharge frequency and kinetics of the generated species, the DBD plasma characteristics and the polymerized films were investigated.
The ICCD fast imaging and OES measurements were used in conjunction with discharge current recordings to characterize the DBD plasma generated in He and He/EG vapor mixtures in the 2–10 kHz discharge frequency range. Spectrally integrated ICCD fast images of the primary (1ry) and secondary (2ry) plasmas were recorded at different delays from the positive and negative discharge current peaks, respectively. The associated current peak recordings revealed that the frequency variation of the discharge current was considerably impacted by the introduction of monomer vapors into the discharge gap. Likewise, the vibrational (Tvib) and rotational (Trot) temperatures, along with the optical signal associated with almost all plasma species, exhibit a decrease with the introduction of a monomer. This behavior was attributed to an increase in the recombination rate of charged particles as well as the inelastic collisions between plasma-generated species when a variety of molecular and atomic species are very likely to be produced by a plasma-induced monomer fragmentation process.
To establish correlations with the results related to plasma parameters, the structure and morphology of pp-PEG fabricated films were explored. It was found that a key factor affecting the morphology of the obtained films is the signal frequency that modulates the plasma discharge. According to the obtained results, as the discharge frequency increases beyond 8 kHz, the morphology of the obtained films becomes porous due to a stronger plasma-induced monomer fragmentation. The FTIR-derived results, such as the presence of carboxylate groups only in plasma-polymerized films, the emerging of the band corresponding to methylene symmetrical deformation and the increase in the hydroxyl stretching vibrational band demonstrate a stronger tendency of monomer fragmentation induced by the DBD plasma at high frequency. Likewise, the mass spectra recorded within the HPLC investigations that show a decrease in the peak intensity with the rate of polymerization (due to the increasingly porous aspect of the film with frequency) came to confirm the stated hypothesis.
Author Contributions
Conceptualization, B.-G.R.; Writing – original draft, B.-G.R., C.U. and M.O.; Supervision, M.B. All authors have read and agreed to the published version of the manuscript.
Funding
This research received no external funding and the APC was funded by [MDPI Invited voucher, code: cd9a73ad84d7851e].
Institutional Review Board Statement
Not applicable.
Informed Consent Statement
Not applicable.
Data Availability Statement
The data presented in this study are available on request from the corresponding author.
Conflicts of Interest
The authors declare no conflict of interest.
References
- Vandenbossche, M.; Hegemann, D. Recent approaches to reduce aging phenomena in oxygen- and nitrogen-containing plasma polymer films: An overview. Curr. Opin. Solid State Mater. Sci. 2018, 22, 26–38. [Google Scholar] [CrossRef]
- Bitar, R.; Cools, P.; De Geyter, N.; Morent, R. Acrylic acid plasma polymerization for biomedical use. Appl. Surf. Sci. 2018, 448, 168–185. [Google Scholar] [CrossRef]
- Sainz-García, E.; López, M.; Múgica-Vidal, R.; Rojo-Bezares, B.; Lozano, C.; González-Marcos, A.; Toledano, P.; Muro-Fraguas, I.; Sainz-García, A.; Sáenz, Y.; et al. Promotion of biofilm production via atmospheric-pressure plasma-polymerization for biomedical applications. Appl. Surf. Sci. 2022, 581, 152350. [Google Scholar] [CrossRef]
- Chen, R.; Shi, C.; Xi, Y.; Zhao, P.; He, H. Fabrication of cationic polymer surface through plasma polymerization and layer-by-layer assembly. Mater. Manuf. Process. 2020, 35, 221–229. [Google Scholar] [CrossRef]
- Goossens, O.; Dekempeneer, E.; Vangeneugden, D.; Van de Leest, R.; Leys, C. Application of atmospheric pressure dielectric barrier discharges in deposition, cleaning and activation. Surf. Coat. Technol. 2001, 142, 474–481. [Google Scholar] [CrossRef]
- Moreno-Couranjou, M.; Guillot, J.; Audinot, J.; Bour, J.; Prouvé, E.; Durrieu, M.; Choquet, P.; Detrembleur, C. Atmospheric pulsed plasma copoly-merization of acrylic monomers: Kinetics, chemistry, and applications. Plasma Process. Polym. 2020, 17, e1900187. [Google Scholar] [CrossRef] [Green Version]
- Reiter, G.; Hamieh, M.; Damman, P.; Sclavons, S.; Gabriele, S.; Vilmin, T.; Raphaël, E. Residual stresses in thin polymer films cause rupture and dominate early stages of dewetting. Nat. Mater. 2005, 4, 754–758. [Google Scholar] [CrossRef]
- Dimitrakellis, P.; Gogolides, E. Hydrophobic and superhydrophobic surfaces fabricated using atmospheric pressure cold plasma technology: A review. Adv. Colloid Interface Sci. 2018, 254, 1–21. [Google Scholar] [CrossRef]
- Mix, R.; Friedrich, J.; Rau, A. Polymer Surface Modification by Aerosol Based DBD Treatment of Foils. Plasma Proc. Polym. 2009, 9, 566–574. [Google Scholar] [CrossRef]
- Corbella, C.; Große-Kreul, S.; von Keudell, A. Exploring the structure of the modified top layer of polypropylene during plasma treatment. Plasma Process. Polym. 2015, 12, 564–573. [Google Scholar] [CrossRef]
- Friedrich, J.F.; Mix, R.; Schulze, R.-D.; Meyer-Plath, A.; Joshi, R.; Wettmar-Shausen, S. New Plasma Techniques for Polymer Surface Modification with Monotype Functional Groups. Plasma Proc. Polym. 2008, 5, 407–423. [Google Scholar] [CrossRef]
- Yasuda, H. Glow discharge polymerization. J. Polym. Sci. Macromol. Rev. 1981, 16, 199–293. [Google Scholar] [CrossRef]
- Friedrich, J. Mechanisms of plasma polymerization—Reviewed from a chemical point of view. Plasma Process. Polym. 2011, 8, 783–802. [Google Scholar] [CrossRef]
- Yin, L.; Pang, Y.; Shan, L.; Gu, J. The In Vivo Pharmacokinetics of Block Copolymers Containing Polyethylene Glycol Used in Nanocarrier Drug Delivery Systems. Drug Metab. Dispos. 2022, 50, 827–836. [Google Scholar] [CrossRef]
- Chifen, A.N.; Knoll, W.; Förch, R. Fabrication of nano-porous silicon oxide layers by plasma polymerisation methods. Mater. Lett. 2007, 61, 1722–1724. [Google Scholar] [CrossRef]
- D’Souza, A.A.; Shegokar, R. Polyethylene glycol (PEG): A versatile polymer for pharmaceutical applications. Expert Opin. Drug Deliv. 2016, 13, 1257–1275. [Google Scholar] [CrossRef]
- Rolim, W.R.; Pieretti, J.C.; Renó, D.L.S.; Lima, B.A.; Nascimento, M.H.M.; Ambrosio, F.N.; Lombello, C.B.; Brocchi, M.; De Souza, A.C.S.; Seabra, A.B. Antimicrobial Activity and Cytotoxicity to Tumor Cells of Nitric Oxide Donor and Silver Nanoparticles Containing PVA/PEG Films for Topical Applications. ACS Appl. Mater. Interfaces 2019, 11, 6589. [Google Scholar] [CrossRef]
- Treglia, A.; Palumbo, F.; Gristina, R.; Calvano, C.D.; Cataldi, T.; Fracassi, F.; Favia, P. Novel aerosol assisted plasma deposition of PEG containing coatings for non-fouling application. Appl. Surf. Sci. 2020, 527, 146698. [Google Scholar] [CrossRef]
- Rusu, G.B.; Asandulesa, M.; Topala, I.; Pohoata, V.; Dumitrascu, N.; Barboiu, M. Atmospheric pressure plasma polymers for tuned QCM detection of protein adhesion. Biosens. Bioelectron. 2014, 53, 154. [Google Scholar] [CrossRef]
- Canal, C.; Khurana, K.; Gallinetti, S.; Bhatt, S.; Pulpytel, J.; Arefi-Khonsari, F.; Ginebra, M. Design of calcium phosphate scaffolds with controlled simvastatin release by plasma polymerization. Polymer 2016, 92, 170–178. [Google Scholar] [CrossRef]
- Rusu, B.-G.; Pohoata, V.; Ionita, C.; Schrittwieser, R.; Dumitrascu, N. Method of obtaining porous polymer structure using atmospheric pressure plasma. Rom. J. Phys. 2016, 61, 518–526. [Google Scholar]
- Rusu, B.G.; Pohoata, V.; Ionita, C.; Schrittwieser, R. Characterization of super hydrophilic films produced in DBD plasma at atmospheric pressure. Dig. J. Nanomater. Biostructures 2015, 10, 941–945. [Google Scholar]
- Chiper, A.S.; Rusu, B.G.; Nastuta, A.V.; Popa, G. On the discharge parameters of a glow-mode DBD at medium and atmospheric pressure. IEEE Trans. Plasma Sci. 2009, 37, 2098–2102. [Google Scholar] [CrossRef]
- Chiper, A.S.; Cazan, R.; Popa, G. On the secondary discharge of an atmospheric-pressure pulsed DBD in He with impurities. IEEE Trans. Plasma Sci. 2008, 36, 2824–2830. [Google Scholar] [CrossRef]
- Massines, F.; Ségur, P.; Gherardi, N.; Khamphan, C.; Ricard, A. Physics and chemistry in a glow dielectric barrier discharge at atmospheric pressure: Diagnostics and modelling. Surf. Coat. Technol. 2003, 174–175, 8–14. [Google Scholar] [CrossRef]
- Nastuta, A.V.; Topala, I.; Popa, G. ICCD imaging of atmospheric pressure plasma jet behavior in different electrode configurations. IEEE Trans. Plasma Sci. 2011, 39, 2310–2311. [Google Scholar] [CrossRef]
- Simek, M.; Ambrico, P.; Prukner, V. ICCD microscopic imaging of a single micro-discharge in surface coplanar DBD geometry: Determination of the luminous diameter of N2 and Ar streamers. Plasma Sources Sci. Technol. 2011, 20, 025010. [Google Scholar] [CrossRef]
- Takashima, K.; Zuzeek, Y.; Lempert, W.R.; Adamovich, I.V. Characterization of a surface dielectric barrier discharge plasma sustained by repetitive nanosecond pulses. Plasma Sources Sci. Technol. 2011, 20, 055009. [Google Scholar] [CrossRef]
- Chiper, A.S.; Anita, V.; Agheorghiesei, C.; Pohoata, V.; Anita, M.; Popa, G. Spectroscopic diagnostics for a DBD plasma in He/air and He/N2 gas mixtures. Plasma Process. Polym. 2004, 1, 57–62. [Google Scholar] [CrossRef]
- Lazarou, C.; Chiper, A.S.; Anastassiou, C.; Topala, I.; Mihaila, I.; Pohoata, V.; Georghiou, G.E. Numerical simulation of the effect of water admixtures on the evolution of a helium/dry air discharge. J. Phys. D Appl. Phys. 2019, 52, 195203. [Google Scholar] [CrossRef]
- Li, J.; Lei, B.; Wang, J.; Xu, B.; Ran, S.; Wang, Y.; Zhang, T.; Tang, J.; Zhao, W.; Duan, Y. Atmospheric diffuse plasma jet formation from positive-pseudo-streamer and negative pulseless glow discharges. Commun. Phys. 2021, 4, 64. [Google Scholar] [CrossRef]
- Yao, C.; Chen, S.; Wang, S.; Chang, Z.; Sun, A.; Mu, H.; Zhang, G.-J. Characteristics of atmospheric Ar/NH3 DBD and its comparison with He/N2 DBD. J. Phys. D Appl. Phys. 2018, 51, 225201. [Google Scholar] [CrossRef]
- Michelmore, A.; Steele, D.A.; Whittle, J.D.; Bradley, J.W.; Short, R.D. Nanoscale deposition of chemically functionalized films via plasma polymerization. RSC Adv. 2013, 3, 13540. [Google Scholar] [CrossRef]
- Chiper, A.; Nastuta, A.; Rusu, G.; Popa, G. On surface elementary processes and polymer surface modifications induced by double pulsed dielectric barrier discharge. Nucl. Instrum. Methods Phys. Res. Sect. B Beam Interact. Mater. At. 2009, 267, 313–316. [Google Scholar] [CrossRef]
- Fatima, H.; Ullah, M.U.; Ahmad, S.; Imran, M.; Sajjad, S.; Hussain, S.; Qayyum, A. Spectroscopic evaluation of vibrational temperature and electron density in reduced pressure radio frequency nitrogen plasma. SN Appl. Sci. 2021, 3, 646. [Google Scholar] [CrossRef]
- Ito, T.; Raddenzati, A.; Shams, A.; Hamaguchi, S. Reverse propagation of atmospheric pressure plasma jets. Jpn. J. Appl. Phys. 2010, 49, 0209. [Google Scholar] [CrossRef]
- Gazeli, K.; Doanh, L.T.; Held, B.; Clément, F. Electrical Thermal and Optical Parametric Study of Guided Ionization Waves Produced with a Compact µs-Pulsed DBD-Based Reactor. Plasma 2018, 1, 23–44. [Google Scholar] [CrossRef] [Green Version]
- Buda, I.G.; Irimiea, C.; Agheorghiesei, C.; Chiper, A.S. Pulsed Atmospheric-Pressure DBD Plasma Produced in Small-Diameter Tubes. IEEE Trans. Plasma Sci. 2015, 43, 572–579. [Google Scholar]
- Ricard, A.; Decomps, P.; Massines, F. Kinetics of radiative species in helium pulsed discharge at atmospheric pressure. Surf. Coat. Technol. 1999, 112, 1–4. [Google Scholar] [CrossRef]
- Wells, G.P.; Estrada-Raygoza, I.C.; Thamban, P.S.; Nelson, C.T.; Chung, C.W.; Overzet, L.J.; Goeckner, M.J. Understanding the Synthesis of Ethylene Glycol Pulsed Plasma Discharges. Plasma Process. Polym. 2013, 10, 119–135. [Google Scholar] [CrossRef]
- Chen, J.; Lu, X.; Wen, Q.; Jiang, F.; Lu, J.; Lei, D.; Pan, Y. Review on laser-induced etching processing technology for transparent hard and brittle materials. Int. J. Adv. Manuf. Technol. 2021, 117, 2545–2564. [Google Scholar] [CrossRef]
- Tavares, J.; Swanson, E.J.; Coulombe, S. Plasma Synthesis of Coated Metal Nanoparticles with Surface Properties Tailored for Dispersion. Plasma Process. Polym. 2008, 5, 759. [Google Scholar] [CrossRef]
- Dhillon, P.K.; Brown, P.S.; Bain, C.D.; Badyal, J.P.S.; Sarkar, S. Topographical length scales of hierarchical superhydrophobic surfaces. Appl. Surf. Sci. 2014, 317, 1068–1074. [Google Scholar] [CrossRef] [Green Version]
Figure 1.
Experimental arrangement of the pulsed DBD plasma generated at atmospheric pressure in He or He/ethylene glycol vapor mixture used for the fabrication of porous pp-PEG films.
Figure 1.
Experimental arrangement of the pulsed DBD plasma generated at atmospheric pressure in He or He/ethylene glycol vapor mixture used for the fabrication of porous pp-PEG films.

Figure 2.
(a) Temporal profile of the applied voltage with generated electrical current during DBD. (b) 30 ns gated ICCD spectrally integrated images of the primary (1ry) and secondary (2ry) DBD plasma expanding in He. The inserted sketch shows the placement of the discharge electrodes, where GR represents the ground electrode and HV represents the high-voltage electrode.

Figure 3.
Variation with frequency of the current intensity peak of the 1ry (a) and 2ry (b) discharge in He and He with ethylene glycol (EG) vapors.
Figure 3.
Variation with frequency of the current intensity peak of the 1ry (a) and 2ry (b) discharge in He and He with ethylene glycol (EG) vapors.

Figure 4.
Spatio-temporal evolution of the primary (1ry) (a,b) and secondary (2ry) DBD plasmas (c,d) in He and He with ethylene glycol (EG) vapors recorded for a voltage frequency of 5 kHz.
Figure 4.
Spatio-temporal evolution of the primary (1ry) (a,b) and secondary (2ry) DBD plasmas (c,d) in He and He with ethylene glycol (EG) vapors recorded for a voltage frequency of 5 kHz.


Figure 5.
Space-integrated OES obtained results: (a) wide emission spectra recorded for 2 kHz applied voltage frequency; (b) nitrogen vibrational emitted bands, and , with involved transitions; intensity variations of the most representative plasma species with frequency, recorded for DBD plasma operated in (c) He and (d) He with ethylene glycol (EG) vapors.


Figure 6.
Variations with frequency of the calculated rotational (a) and vibrational (b) temperatures for DBD operated in He and He/ethylene glycol (EG) vapor mixture.
Figure 6.
Variations with frequency of the calculated rotational (a) and vibrational (b) temperatures for DBD operated in He and He/ethylene glycol (EG) vapor mixture.

Figure 7.
SEM-derived results of pp-PEG obtained films: (a) SEM image of a pp-PEG film obtained in atmospheric-pressure DBD at 2 kHz; (b) thickness variation of the obtained films with frequency with an inset showing the cross-section of the sample obtained at 8 kHz; and (c) SEM topography of the sample obtained at 8 kHz.

Figure 8.
FTIR spectra of pp-PEG films obtained in atmospheric-pressure DBD at different discharge frequencies: (a) vibration bands with low oscillation frequency and (b) IR-recorded bands with high oscillating frequency; the IR spectrum of ethylene glycol (EG) was added for comparison.
Figure 8.
FTIR spectra of pp-PEG films obtained in atmospheric-pressure DBD at different discharge frequencies: (a) vibration bands with low oscillation frequency and (b) IR-recorded bands with high oscillating frequency; the IR spectrum of ethylene glycol (EG) was added for comparison.

Figure 9.
Mass spectra of the pp-PEG films obtained in an atmospheric-pressure DBD working in He with ethylene glycol (EG) vapors at different applied voltage frequencies.
Figure 9.
Mass spectra of the pp-PEG films obtained in an atmospheric-pressure DBD working in He with ethylene glycol (EG) vapors at different applied voltage frequencies.

Disclaimer/Publisher’s Note: The statements, opinions and data contained in all publications are solely those of the individual author(s) and contributor(s) and not of MDPI and/or the editor(s). MDPI and/or the editor(s) disclaim responsibility for any injury to people or property resulting from any ideas, methods, instructions or products referred to in the content. |
© 2023 by the authors. Licensee MDPI, Basel, Switzerland. This article is an open access article distributed under the terms and conditions of the Creative Commons Attribution (CC BY) license (https://creativecommons.org/licenses/by/4.0/).
Share and Cite
MDPI and ACS Style
Rusu, B.-G.; Ursu, C.; Olaru, M.; Barboiu, M. Frequency-Tuned Porous Polyethylene Glycol Films Obtained in Atmospheric-Pressure Dielectric Barrier Discharge (DBD) Plasma. Appl. Sci. 2023, 13, 1785. https://doi.org/10.3390/app13031785
AMA Style
Rusu B-G, Ursu C, Olaru M, Barboiu M. Frequency-Tuned Porous Polyethylene Glycol Films Obtained in Atmospheric-Pressure Dielectric Barrier Discharge (DBD) Plasma. Applied Sciences. 2023; 13(3):1785. https://doi.org/10.3390/app13031785
Chicago/Turabian StyleRusu, Bogdan-George, Cristian Ursu, Mihaela Olaru, and Mihail Barboiu. 2023. "Frequency-Tuned Porous Polyethylene Glycol Films Obtained in Atmospheric-Pressure Dielectric Barrier Discharge (DBD) Plasma" Applied Sciences 13, no. 3: 1785. https://doi.org/10.3390/app13031785
Note that from the first issue of 2016, this journal uses article numbers instead of page numbers. See further details here.