
Experimental Study of RF–Plasma Interaction Using a Low-Pressure DC Glow Discharge Tube for MPC


1
Department of Electrical Engineering, Capital University of Science and Technology, Islamabad 44000, Pakistan
2
Center for Wireless Communications, Faculty of Information Technology and Electrical Engineering, University of Oulu, 90570 Oulu, Finland
*
Authors to whom correspondence should be addressed.
Electronics 2023, 12(3), 551; https://doi.org/10.3390/electronics12030551
Submission received: 26 November 2022
/
Revised: 12 January 2023
/
Accepted: 19 January 2023
/
Published: 20 January 2023
(This article belongs to the Special Issue Advanced RF, Microwave Engineering, and High-Power Microwave Sources)
Abstract
:This paper aims to perform experimental validation of RF–plasma interaction behaviors for the purposes of wave transmission and reflection. Wave reflection from plasma is of interest as it finds applications in pulse compression and RF polarizer-based systems. Simulations are performed using a combination of Magic3D and COMSOL multiphysics to characterize the plasma–wave interaction and discharge tube properties. The goal is to generate plasma with characteristics that wholly reflect the incident electromagnetic wave. A glass tube of inner diameter 22 mm and length 100 mm, with 12 mm brass electrodes, is fabricated for plasma generation. Argon-based DC glow discharge is sustained at 500 volts at a pressure of 3.8 Torr. Plasma density is calculated to be m, with a corresponding plasma frequency of 7.18 GHz. Due to this higher frequency, a 3 GHz incident RF wave is reflected, as measured through S-parameter measurements using a network analyzer. Off and on states of the tube correspond to dB and dB, which show wave transmission and reflection, respectively. When the plasma column is ignited, the reflected wave has a phase difference of .
1. Introduction
Plasma has gained widespread use in recent years, with applications ranging from commercial industry [1] to defense applications. One of the significant ways plasma is applied to high-power microwave (HPM) systems is by utilizing its ability to behave as a high-frequency switch. Plasma sources are able to operate both in continuous and repetitive or pulsed operating conditions, allowing narrow or wide charge particle beams to be formed. Due to fast response times, a plasma switch can be used in microwave pulse compression (MPC) systems to reflect radio frequency (RF) waves, enabling high-power discharge [2].
Different types of gas discharge can be used for plasma generation, such as cold-cathode glow discharge, arc-type discharge, triggered discharge, high-frequency discharge, etc. The design process for each application requires different characteristics in the plasma. While it is possible to generate plasma at atmospheric pressure, most applications utilize a low vacuum (1–1000 Pa) for the plasma source. Some important things to consider are the conductivity, the frequency of the plasma, the frequency of the collisions, and the permittivity in both the longitudinal and radial directions. Most of the time, there are only two ways to make plasma: with an electrode or without one. The former uses a voltage for excitation, and the latter is generated with high-power radio frequency (RF).
In the first method, DC excitation is more common than others. This is in contrast to RF–plasma, which is generated by exposing a plasma tube to a high-power RF signal generated by a suitable device, e.g., Klystron. This generates plasma at the frequency of the RF. Notable applications of this interaction are plasma antennas [3] and plasma torches [4]. In this paper, the DC-excited plasma switch is considered. The plasma is created by applying a DC voltage over the gas-filled gap between two electrodes. Such DC discharge has been the subject of intensive research for decades. The DC discharge and, in particular, the DC glow discharge have been historically important both for studying the properties of the plasma, as well as for the various applications where the DC discharge is used to provide a weakly ionized plasma. DC discharge can be used as a light source, as a gas laser, as an electron source for Hall thrusters, as a pixel in a plasma display panel, or as a tool for sputter deposition [5,6].
This paper also pertains to the practical formation of plasmas, with a focus on plasma interaction with electromagnetic (EM) waves. In the case of high-power microwave systems, plasmas are either used to absorb the EM wave or reflect it. Both cases exist under different circumstances, which will be discussed in the following. Section 2 describes the behavior of the interaction between RF waves and plasma. Furthermore, Section 3 shows simulations of the discharge tube as conducted in Magic3D and COMSOL multiphysics for plasma characterization and interaction visualization. Section 4 shows experimental testing of RF–plasma interaction, and results are compared to the simulated values. Finally, the paper is concluded in Section 5.
2. RF–Plasma Interaction
Plasma is characterized by the number of particles either ions or electrons or both in any combination per unit volume (plasma density) oscillating at a certain frequency called the plasma frequency. It can be generated either by heating a neutral gas or subjecting this gas to a strong EM field. Depending on this density and the frequency, a wave might be reflected, absorbed, or transmitted by the plasma medium. This behavior of interaction between RF () and a plasma frequency () is determined by the permittivity of the plasma medium. The effective permittivity () can be defined for a uniform plasma region as:
where
where q is the charge of the electron, is the mass of the electron, is the number of ionized particles per unit volume, and is the permittivity of free space. By studying the solution of Maxwell’s equations for plane wave propagation in such a medium [7], it can be shown that wave propagation through a plasma is only possible for [8]. Lower-frequency waves will be reflected. If a magnetic field is present, the plasma becomes anisotropic, and the analysis is more complicated. However, magnetic field-focused plasmas are outside the scope of this paper.
RF–plasma interaction can be visualized through simulation (see Figure 1). By injecting an RF wave into a structure with a plasma column in its path, we can check the interaction behavior. This behavior is observed in Magic3D, where a simple waveguide structure for an S-band wave is constructed. Figure 1 shows a two-dimensional (2-D) cross section of a WR-284 waveguide with a switch placed near the boundary. When the waveguide is excited, a standing wave is established in the waveguide when the switch is in the off-state. There is almost no power going towards the upper open port of the waveguide. When the plasma switch is activated, it acts as a metallic obstacle in the path of the EM wave and creates a short at the switch position. As a result, the EM wave reflects back from this switch, as shown in Figure 2. Now, as we can see from Figure 2, almost all the stored power is going towards the output port of the waveguide. This is the fundamental interaction between a plasma column and an EM wave, which we have aimed to replicate via the use of a plasma tube placed within a waveguide.
Discharge Tube
Applying a DC voltage over the gas-filled gap between two electrodes in a discharge tube produces the plasma. To keep the discharge going, there has to be a few hundred volts maintained between the cathode and anode. The working gas pressure, composition, working gas type, applied voltage, and discharge profile all affect the kind of discharge that develops between the two electrodes. Electric current flowing through a gaseous medium is referred to as a gas discharge. The DC glow discharge manifests itself in the discharge current range of A to mA and in the pressure range of 0.5–1000 Pa. Some of the atoms and molecules of the gas must be ionized for discharge to take place. Additionally, this current requires an electric field to be driven. The discharge must have constant current flowing through it for the entire length of the discharge tube. Ions and electrons produced in the plasma volume, as well as electrons emitted from the cathode, drive the current in a DC discharge.
The diverse plasma species do not all have the same temperature because the various particles are typically not in thermal equilibrium. In particular, the electrons can be readily accelerated to the high energies necessary to excite and ionize neutral atoms or molecules due to their low mass. Therefore, the temperature of the electrons is substantially higher than that of the heavier particles (ions, atoms, and molecules), or , where is the electron temperature, is the ion temperature, and is the neutral gas temperature.
The gas pressure is a significant factor affecting the temperature of the plasma species and the thermal equilibrium between species. Few collisions happen at low pressure, and the transmission of energy between species is ineffective. The numerous collisions between the different plasma species that take place under high pressure lead to more evenly distributed temperatures between the species. A very distinctive appearance can be seen in the low-pressure DC glow discharge, which is shown in Figure 3.
An electrically conductive metal is generally used to create the cathode. Utilizing secondary electron emission, the cathode’s electrons are used to keep the discharge going after a favorable ion bombardment of the cathode surface. The positive column occasionally exhibits prominent and regular luminous striations, which may be stationary or moving down the length of the tube. In a DC glow, the stratification of the column moves in alternating bright and dark regions. In molecular gases (such as hydrogen, nitrogen, and oxygen) and mixtures of molecular and rare gases, standing striations can be seen with the bare eye [9]. The primary dark space, also known as the Aston dark space, is located in front of the cathode and is where the secondary electrons are gathered. The cathode glow, which has a comparatively high ion density, is located next to the Aston dark space. At this point, the secondary electrons start moving very quickly away from the cathode. The cathode begins to glow as these high-energy electrons begin to collide with neutral gas atoms at a distance from the cathode corresponding to the mean-free path.
The working gas and the cathode material can both be identified by the hue of the light that is produced. The type of gas and gas pressure affect the axial length of the cathode glow. Following the cathode glow is the cathode’s (Crookes or Hittorf) black space, which has a moderate electric field and a positive, relatively high-density space charge. The positive ions are likewise driven in this area toward the cathode. Since ions have far lower mobility than electrons, they make up the majority of this dark area. The negative glow is followed by the black space of the cathode. The light intensity of the discharge’s negative glow is the brightest. In this area, excitement and ionizing collisions result from the secondary electrons’ acceleration. The current is virtually exclusively carried by electrons in this situation, and there is a low electric field.
3. Plasma Study and Simulation Results
For this study, we selected argon as the medium for plasma generation due to its characteristics of easy ionization and uniform plasma. For an argon column, we can use COMSOL simulation to determine the electron density in the switch with appropriate simulation paramters. The column is designed as follows: A 100-mm-long tube defined as a dielectric material boundary is defined with two long metal inserts on both ends of 12 mm each, with one defined as an anode and one as a cathode. The physical parameters are given in Table 1. Reduced electron mobility characterizes how quickly an electron can move through a solid material when pulled by an electric field. Work function represents the minimum amount of energy required to pull an electron out of any emitter, such as a cathode. These parameters will also be utilized for the simulation.
The plasma column is simulated according to parameters that are experimentally feasible. COMSOL multiphysics is utilized, which offers in-depth study with its plasma module. The schematic of the plasma module with labeled components is shown in Figure 4. Most published literature discusses five types of reactions in the plasma. They include ionization, excitations, eliminating excitations, elastic collisions, and attachments. The following types of interactions are possible in all five types of reactions: (1) electrons and neutral molecules; (2) electrons and ions; (3) ions and neutral molecules; (4) neutral–neutral molecules; and (5) surface and wall recombinations. The gas considered in our simulations is argon (). We can excite with simple mechanisms at low pressure.
Plasma chemistry is governed by a set of ionization equations that show the behavior of the selected gas in a plasma state. For the medium, there are both elastic and inelastic (e.g., ionizing) collisions occurring during the plasma-generation process. For instance, the ionization potential of is 15.8 eV, which is an intrinsic property. During the ionization process, also enters a metastable state, where it leads to the excitation of other atoms (known as Penning ionization), which also contributes to the plasma density [10]. The reaction process is intrinsic to the species (in this case, ) and does not rely on the physical geometry of the tube. These equations, along with reaction types and reaction energies, are given in Table 2.
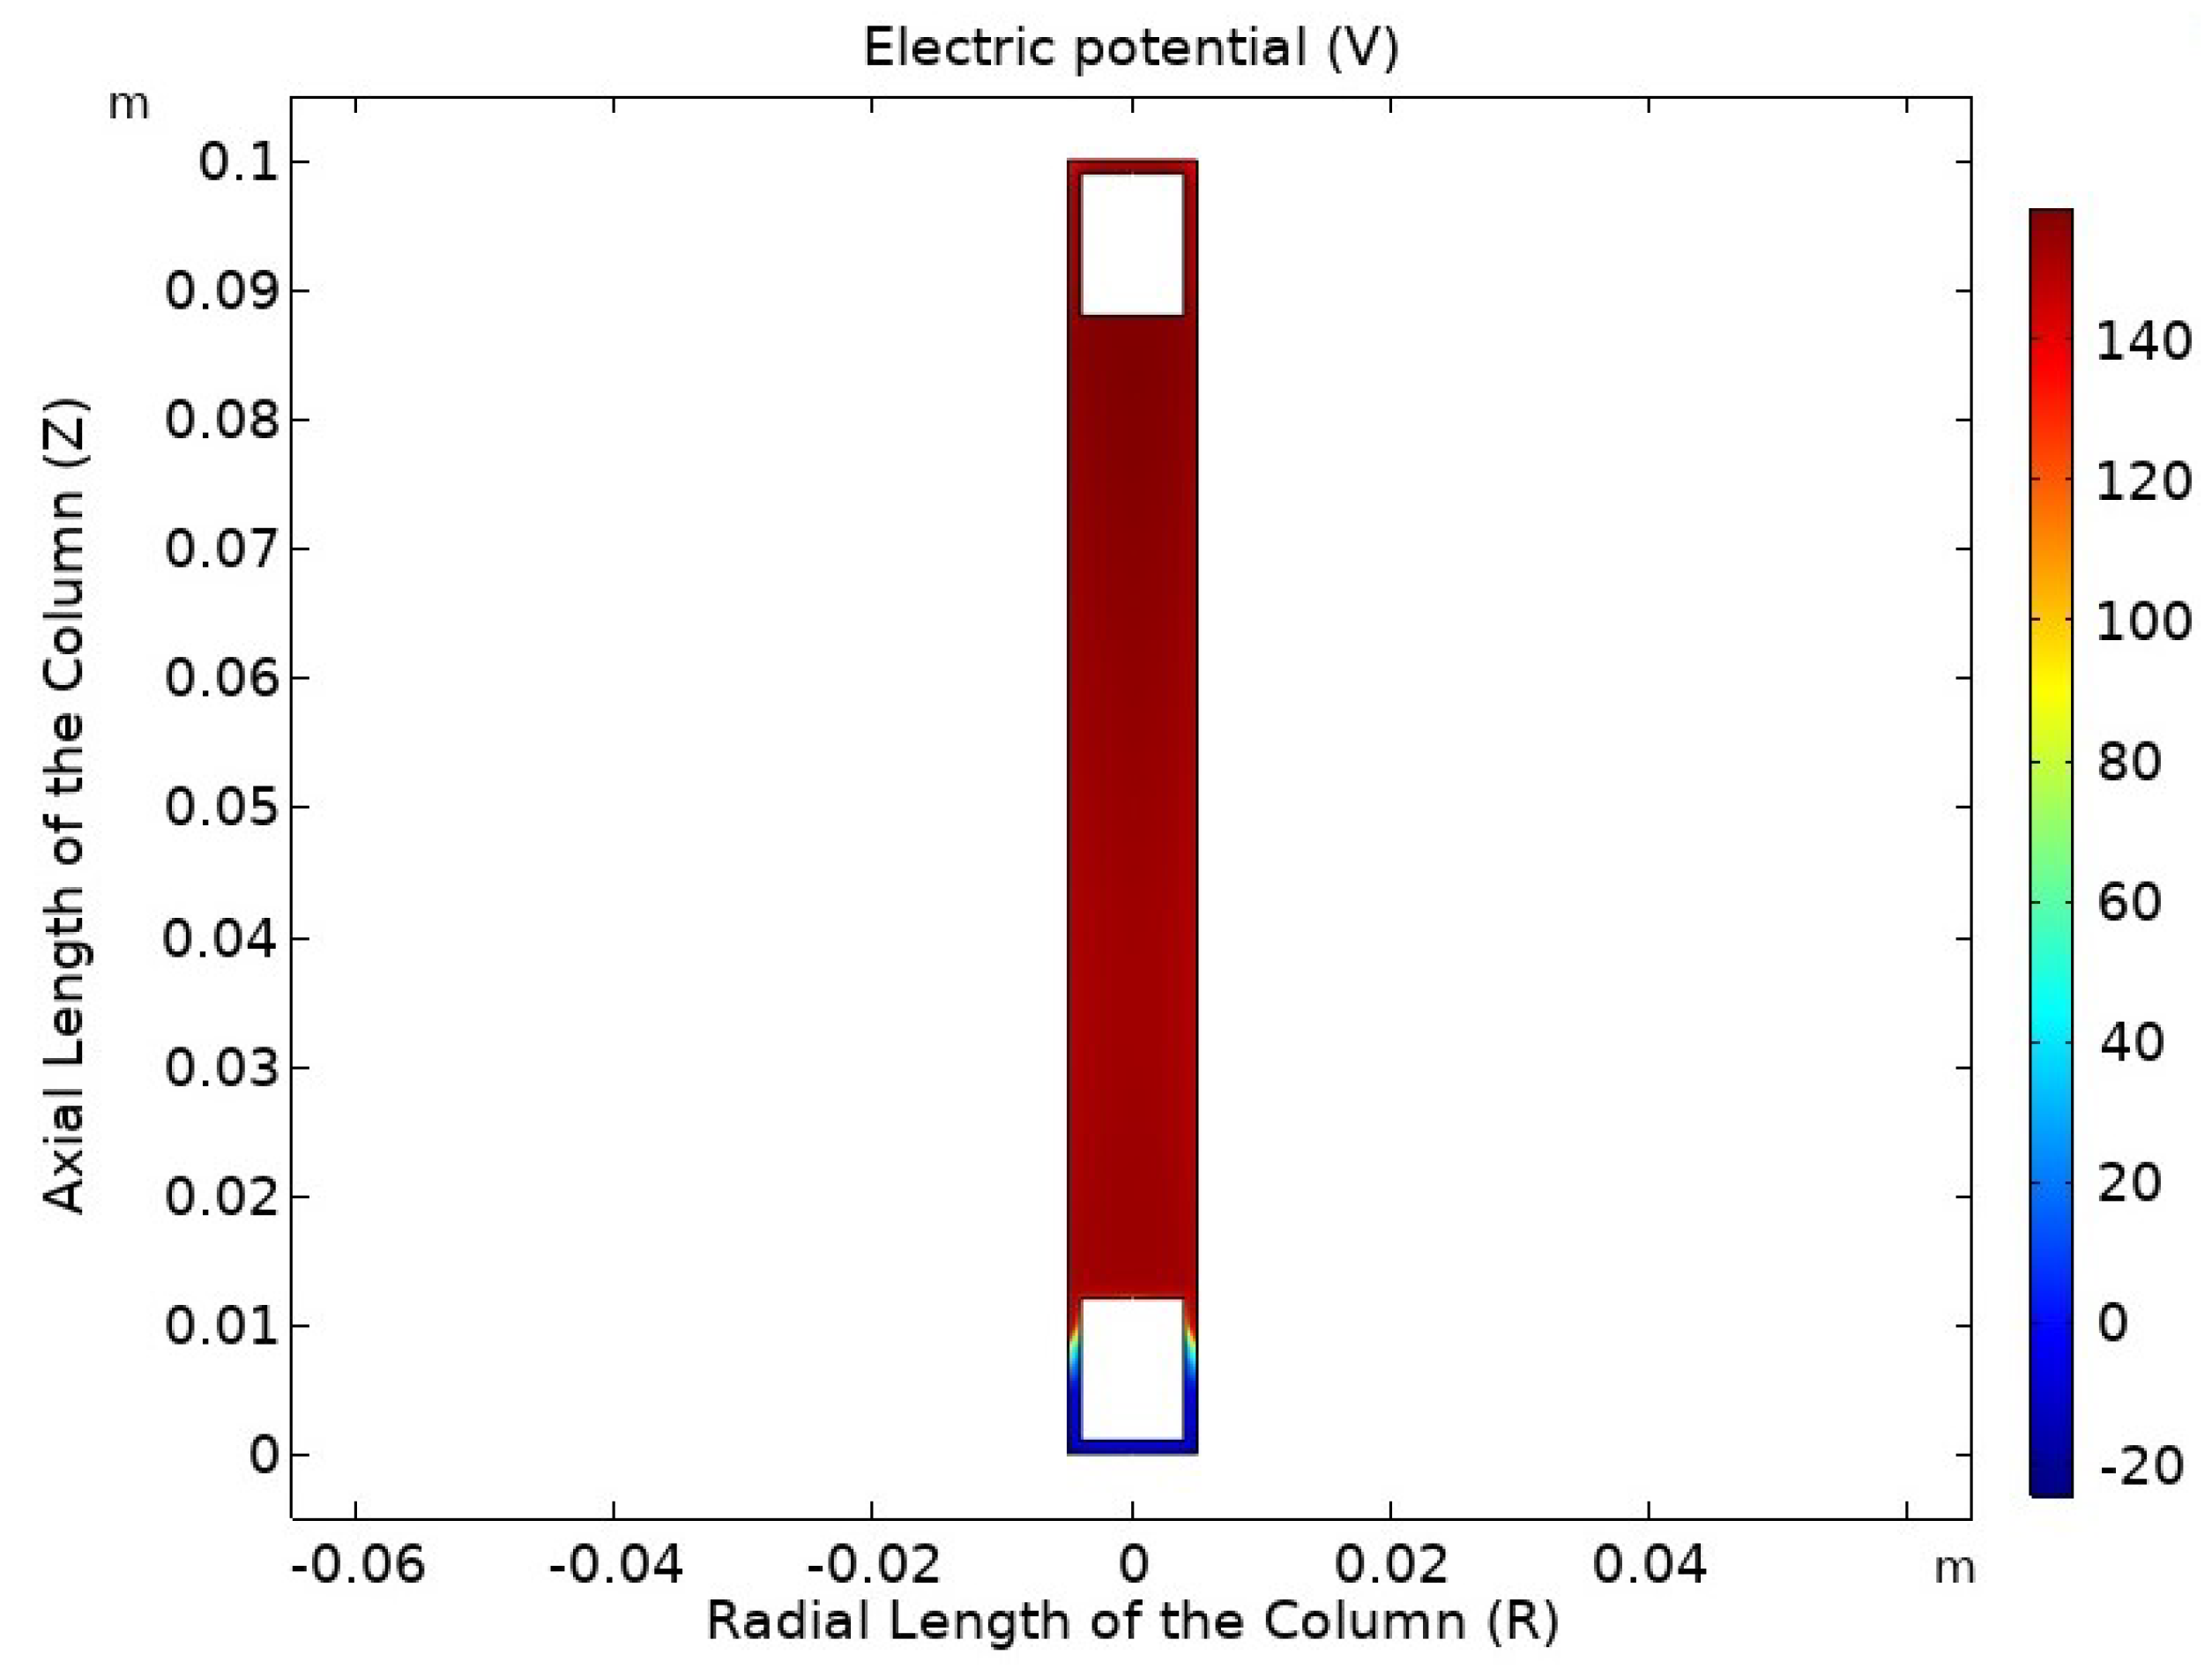
In Table 2, represents an argon atom in an excited state, while shows an argon ion. With physical and chemical parameters (see Table 1 and Table 2), the tube is simulated for t = 1 s. From the simulations, it is observed that the potential across the switch becomes uniform when plasma is generated, as shown in Figure 5. However, the plasma density is not uniform (at 500 V). The density is concentrated near the cathode, in the dark space region (see Figure 6).
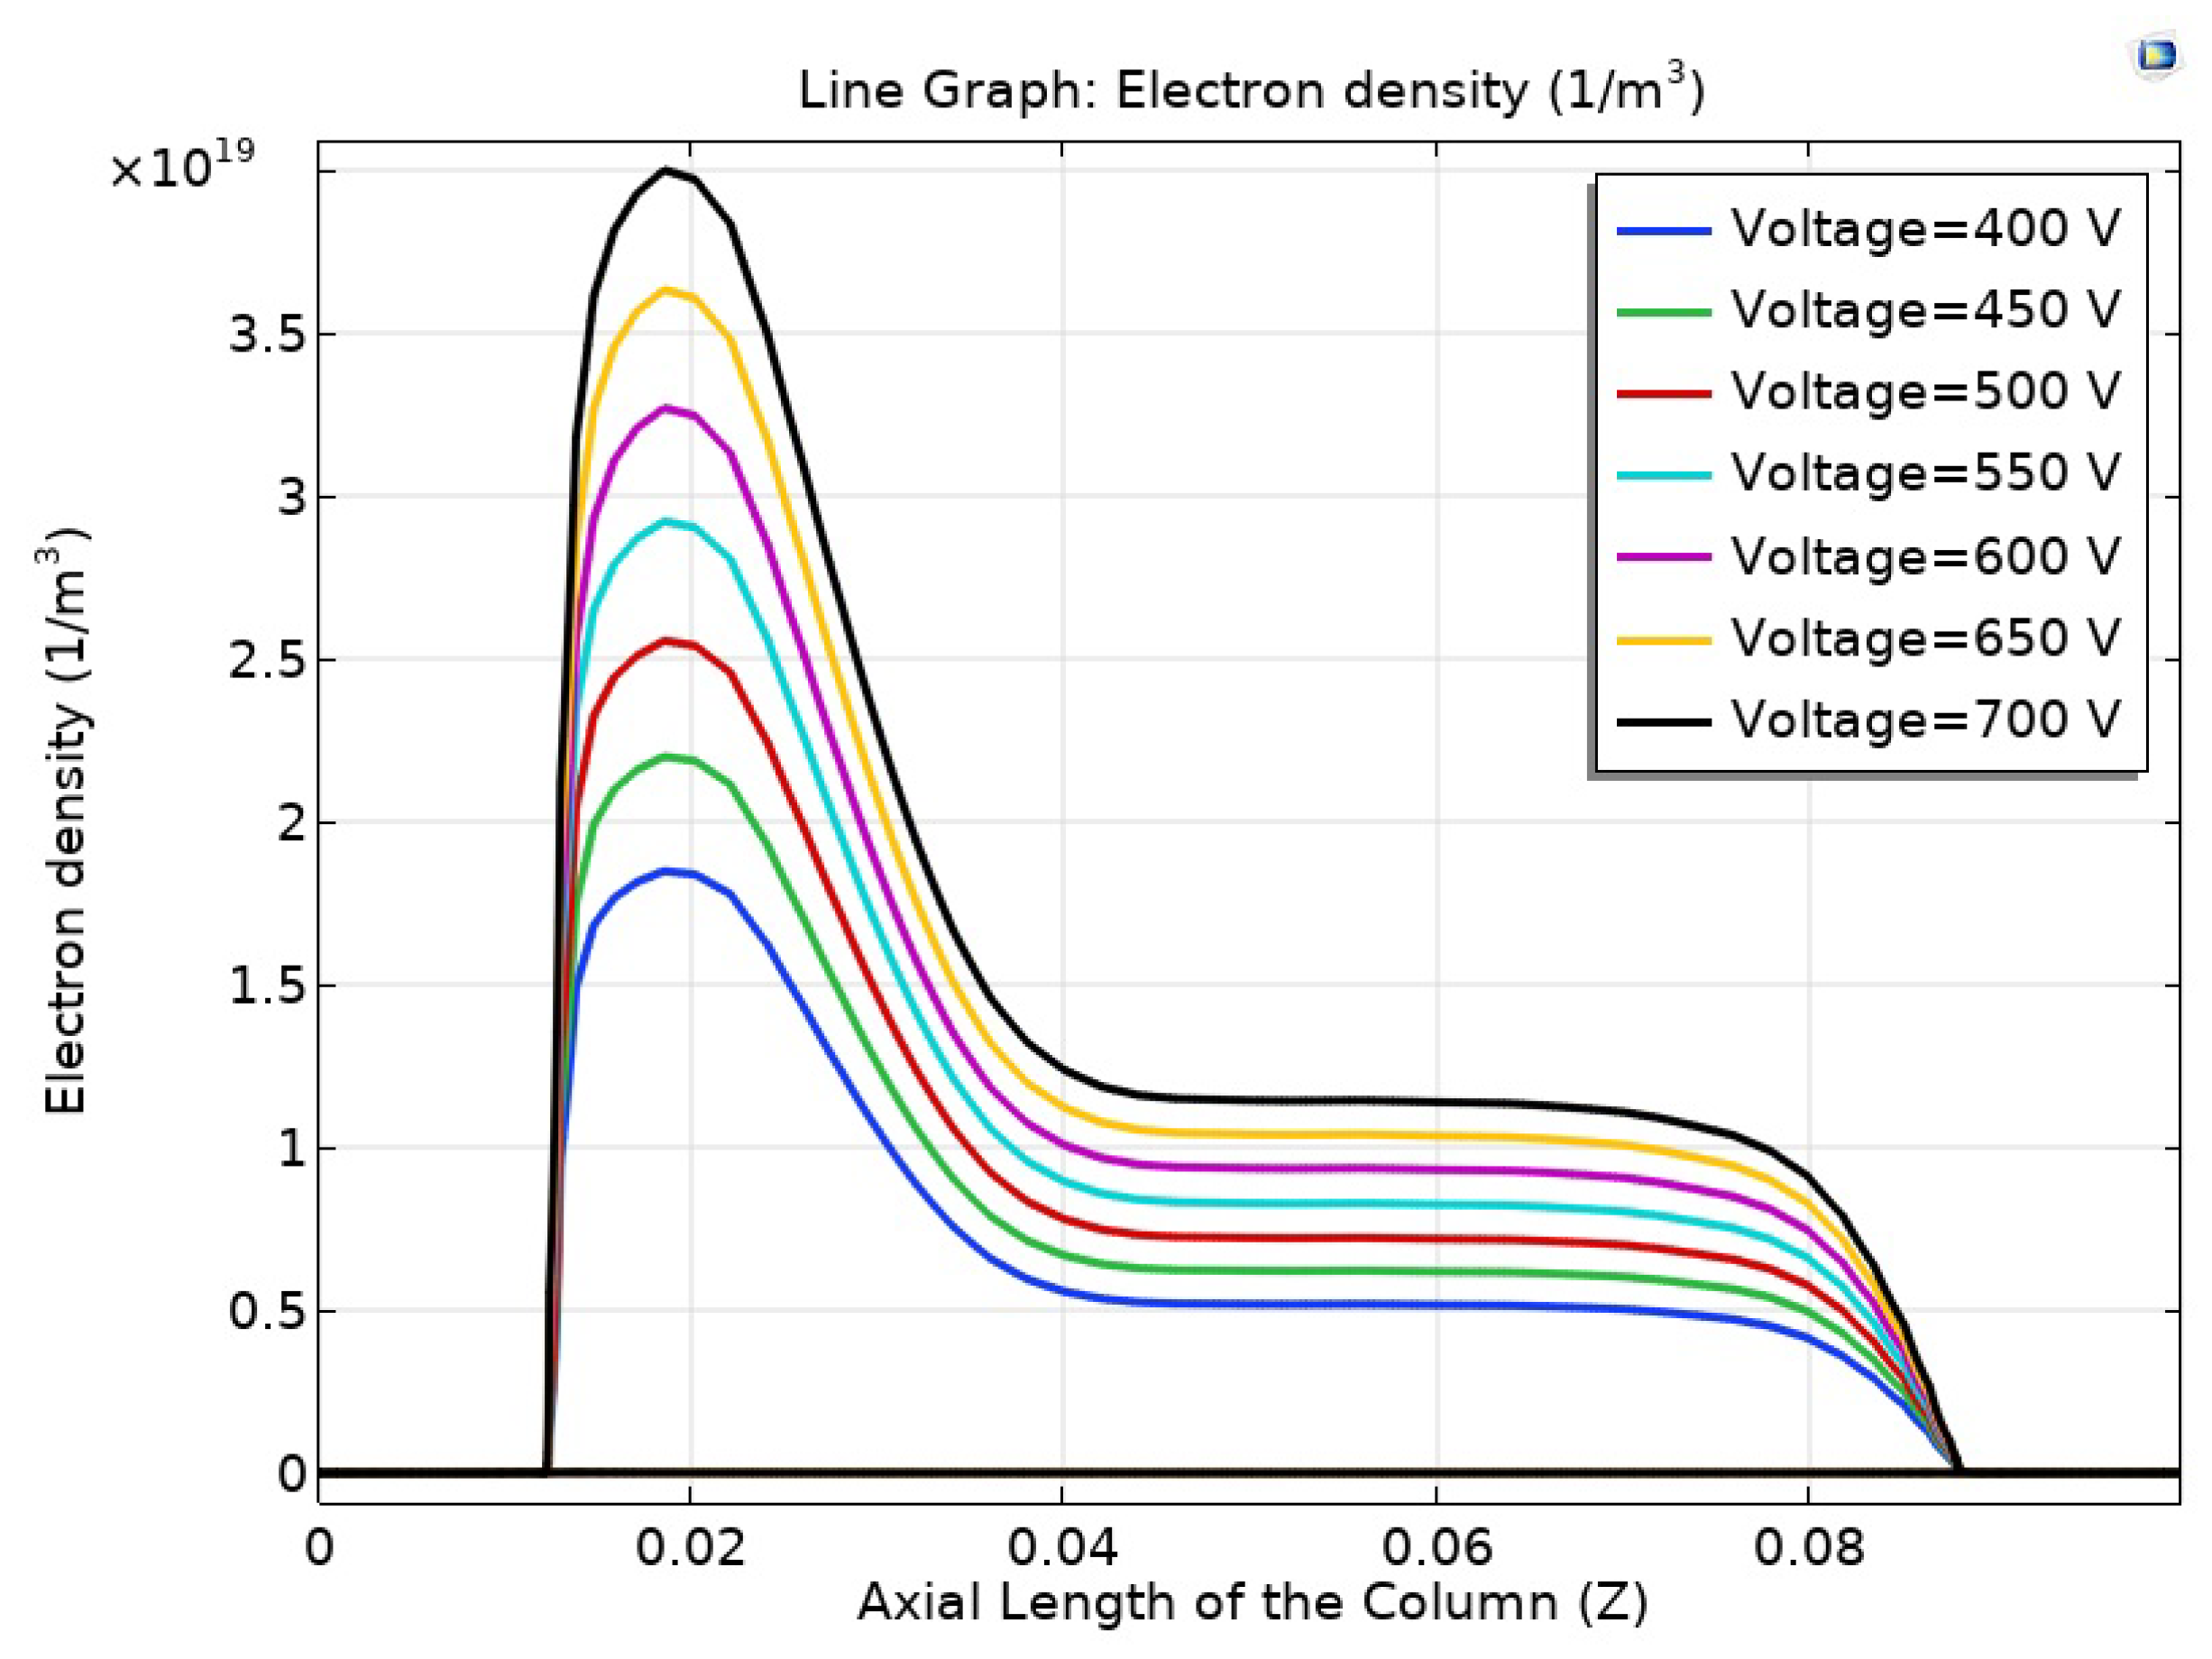
This electron density is plotted across a range of voltages using a parameter sweep. The range is selected as 400–700 V, with intervals of 50 V. It is observed that an increase in voltage corresponds to an increase in electron or ion density, as shown in Figure 7. The curve is plotted against the axial direction and shows the peak plasma density near the cathode, within the Faraday dark space.
For our case, as per the experimental study, we select 500 V as the operating voltage, which corresponds to an electron density of n = 2.5 × 10, which corresponds to a plasma frequency of 7.1 GHz. We compare this with experimental results in the following section.
4. Experimental Setup and Results
The gas discharge tube is made of glass and has an inner diameter of 15 mm and a length of 100 mm. The electrode gap is set to 80 mm, and the pressure in the tube is maintained at 3.8 Torr. Gas tube operation follows Paschen’s law. Electrodes are connected to a high-voltage supply via a high-voltage cable rated for 100 kV. Vacuum pressure is monitored using an Agilent FRG730 digital vacuum gauge. The vacuum assembly is connected via KF fittings and flanges.
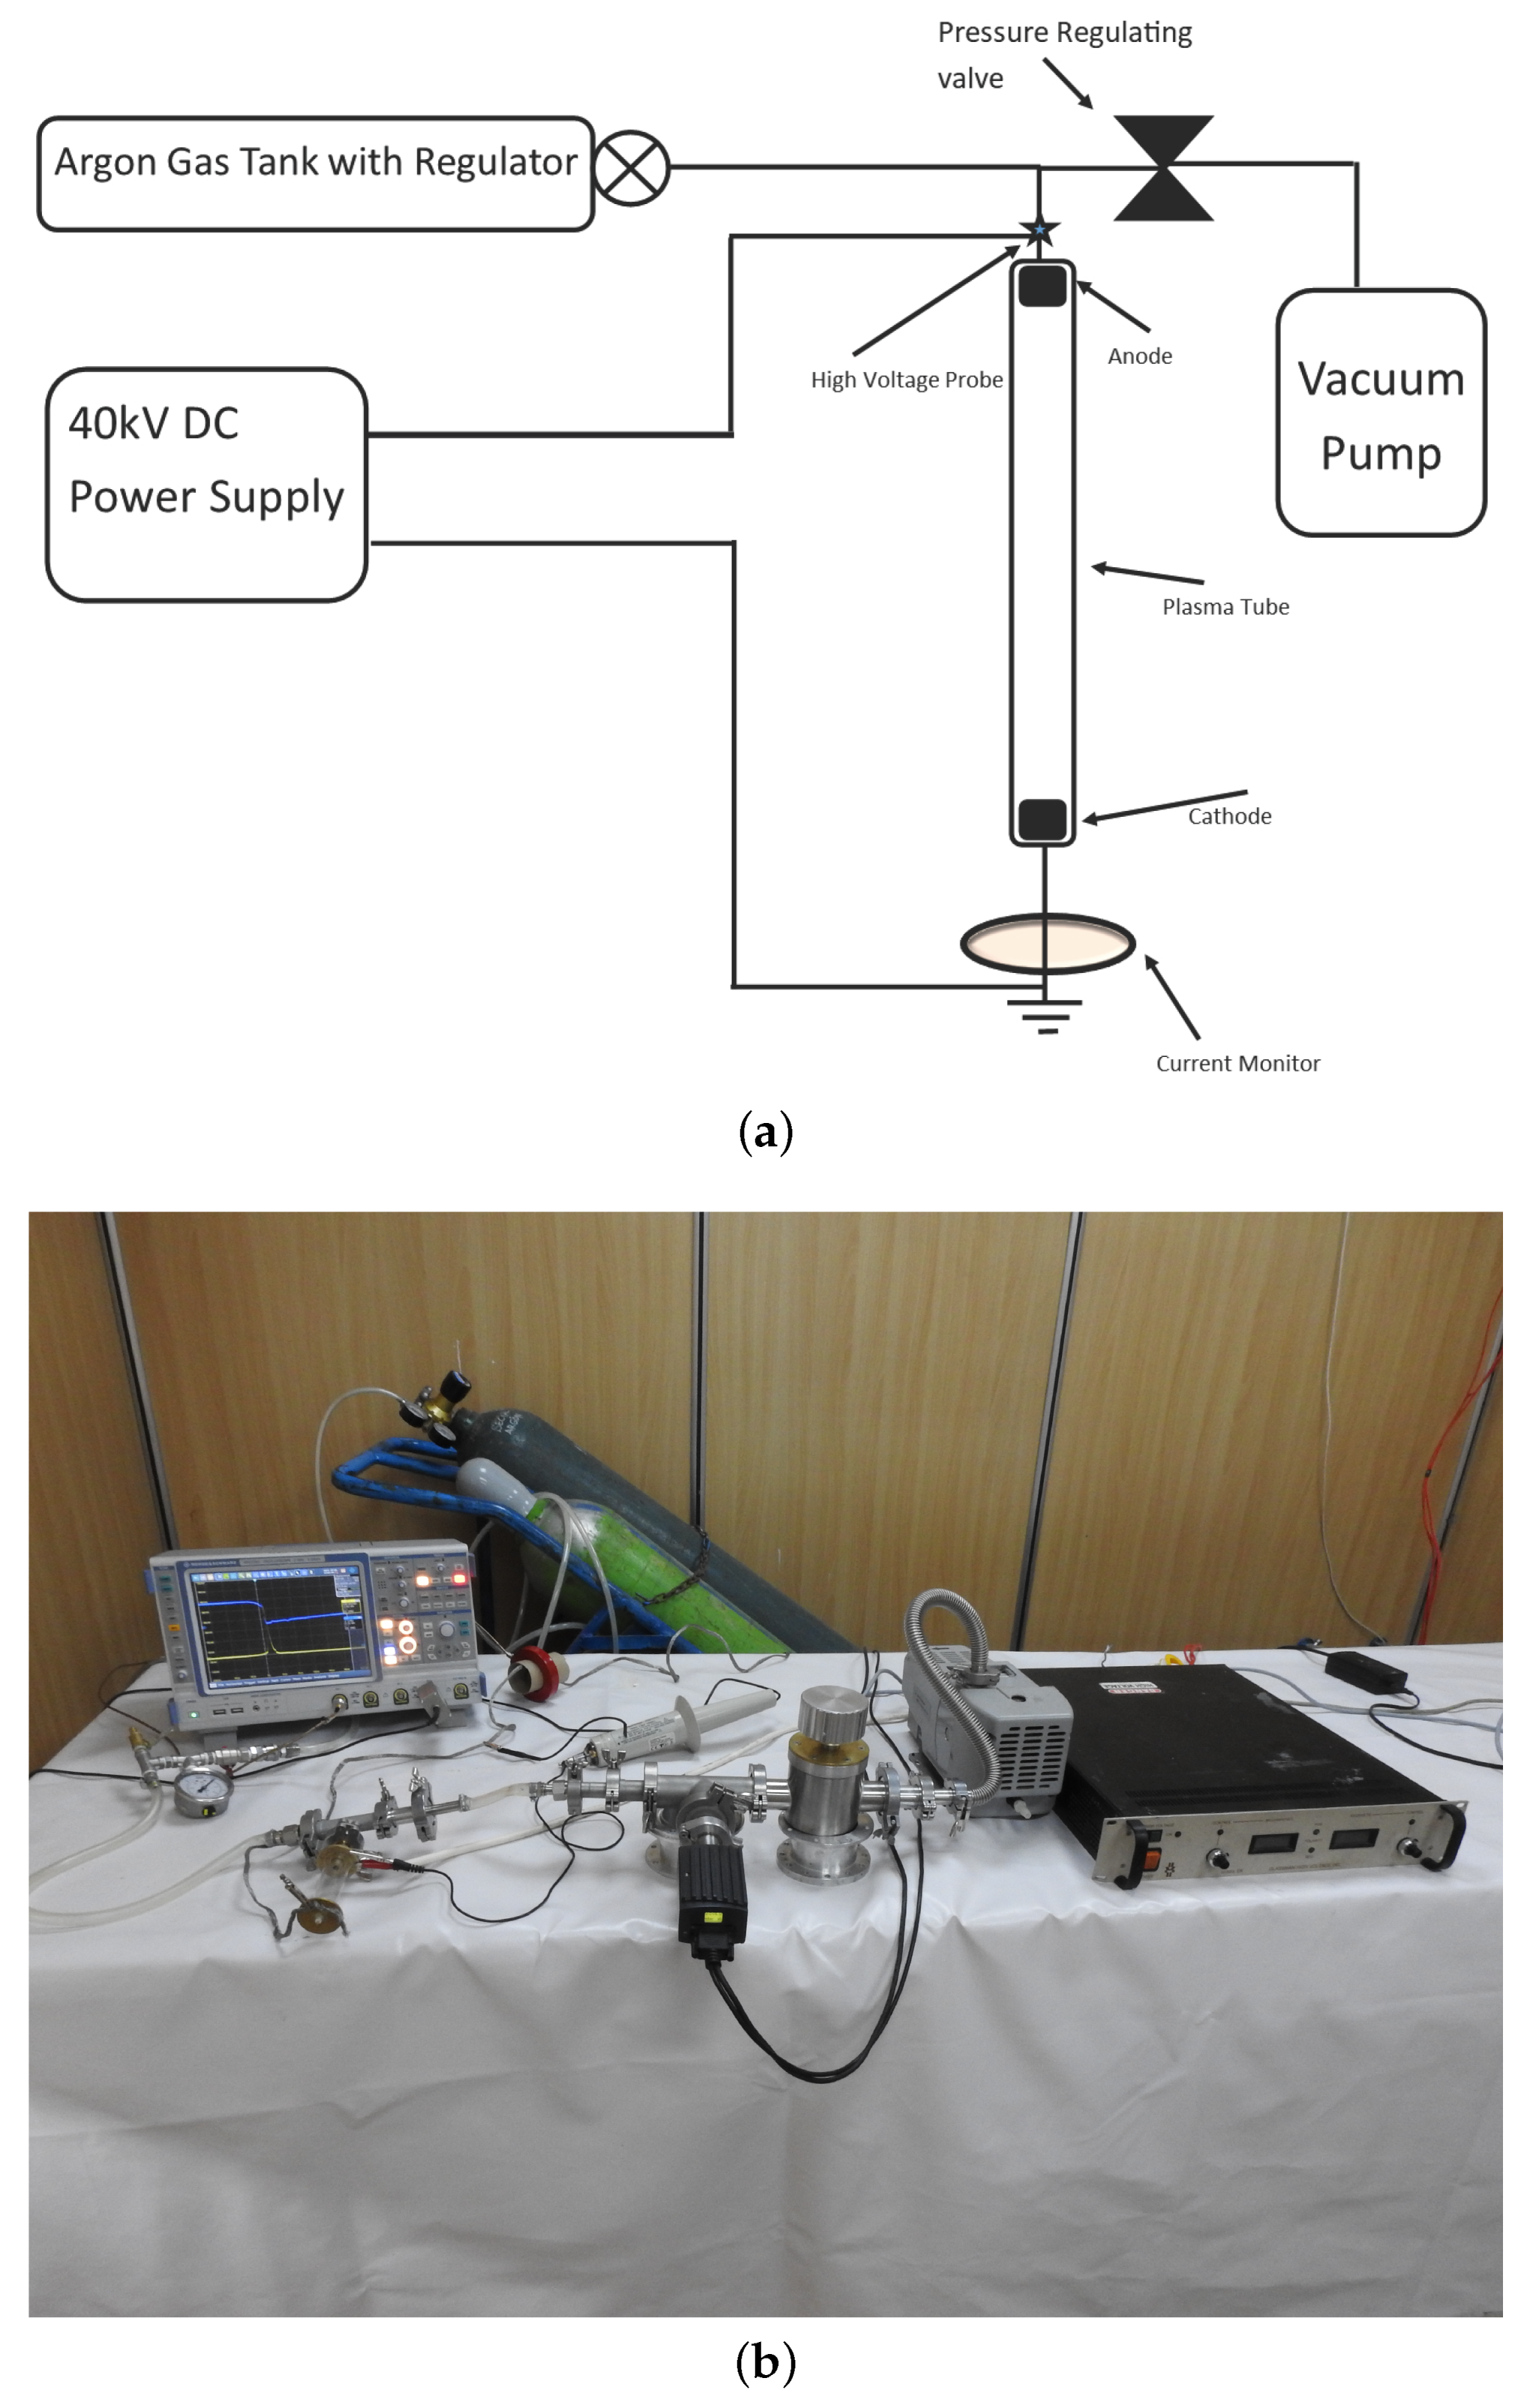
The switch is connected to a 30 kV DC power supply with a maximum current rating of 30 mA. A rotary pump is connected to the tube on one side, and the other side is fed with argon. Vacuum and gas pressures are controlled using a regulating valve at the inlet of the tube. The schematic of the experimental arrangement is shown in Figure 8a and the complete experimental setup is shown in Figure 8b.
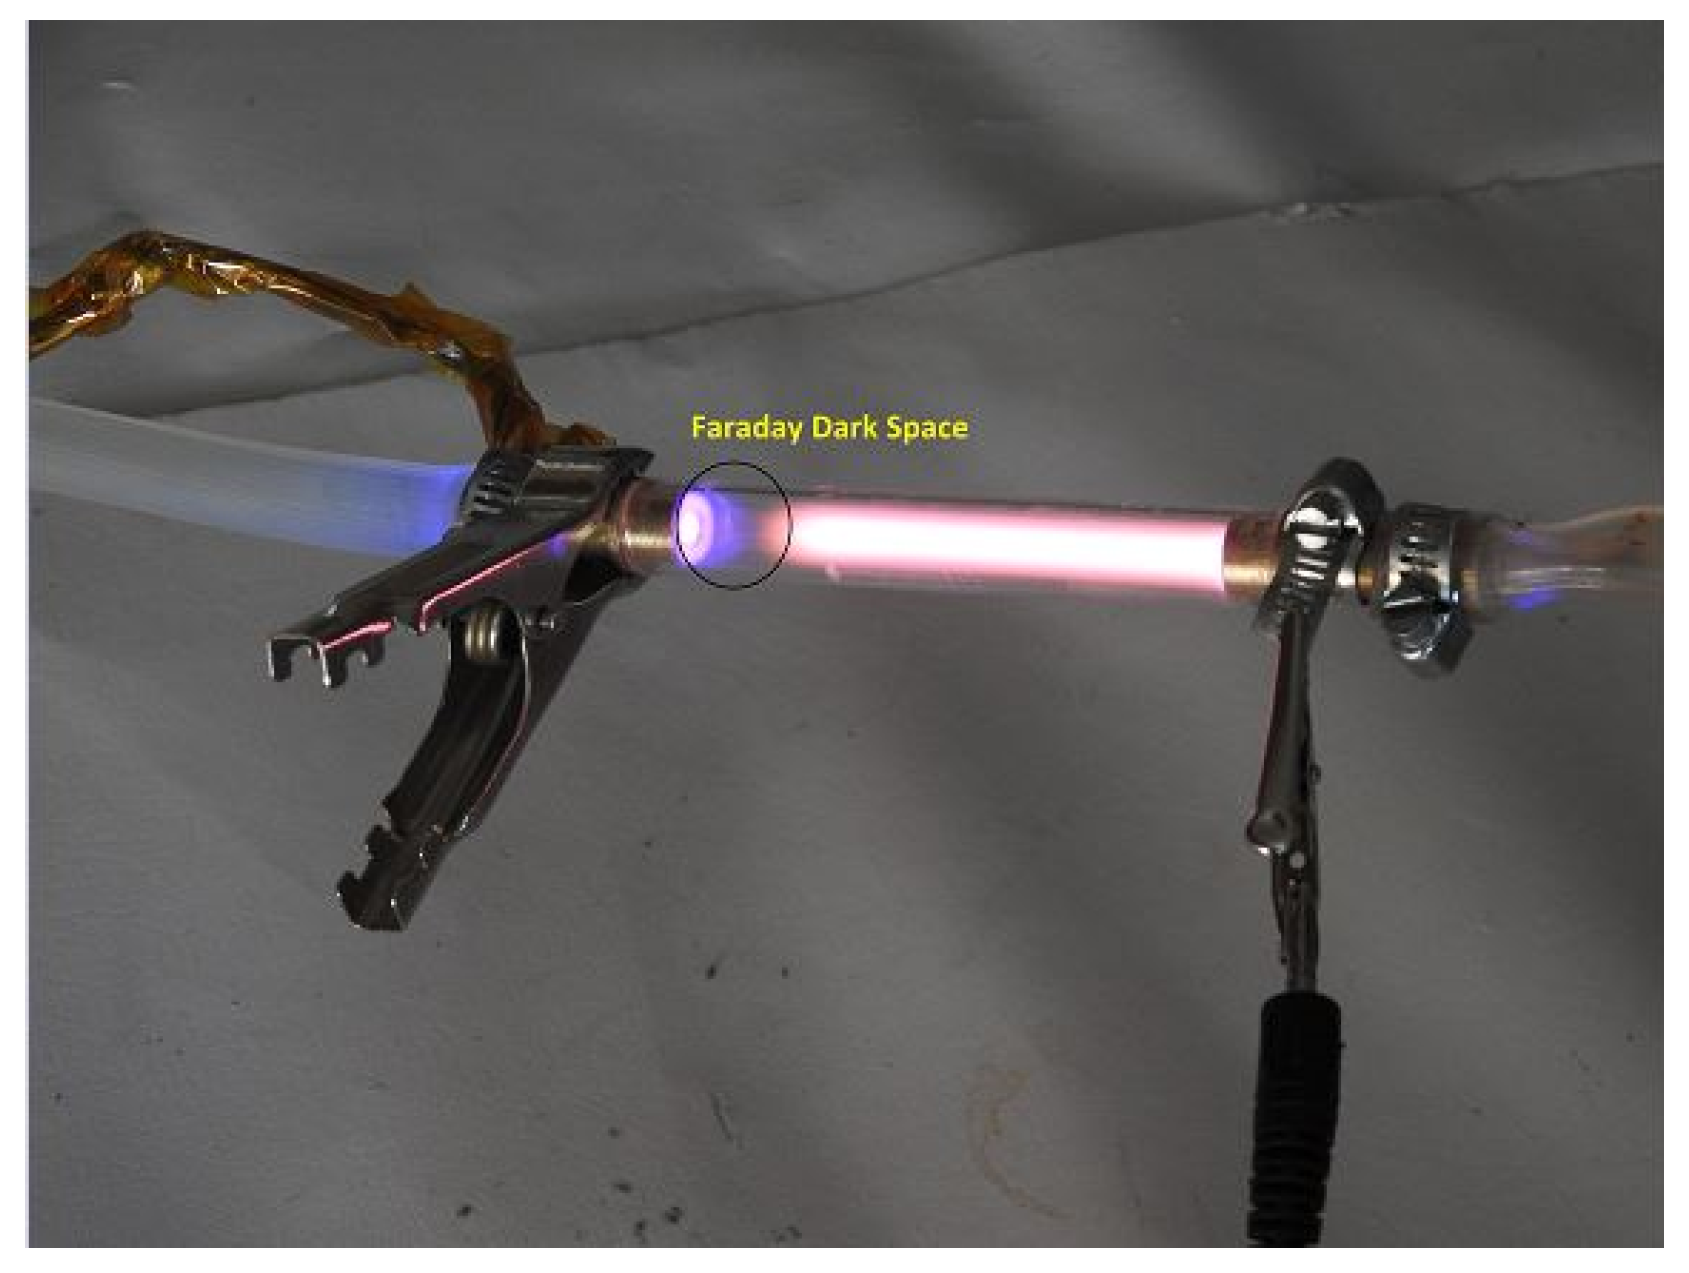
The generated plasma tube is shown in Figure 9. As can be seen, the positive column and Faraday dark space are visible in the tube. When the breakdown voltage is achieved, a bright glow is produced. If the gas-flow rate is increased further, it quenches the plasma channel and arcing is produced. The flow rate is maintained beyond this level to achieve stable DC-glow discharge. The voltage and current characteristics are measured using a high-voltage probe (Tektronix P6015) from Tektronix and a current transformer (Bergoz coil CT-F1.0), respectively. Furthermore, the frequency characteristics of the tube are diagnosed using a Keysight E5071C network analyzer. To validate the RF–plasma interaction, a wideband signal (2.90 GHz–3.06 GHz) is applied from the network analyzer. The tube is placed in a hollow circular waveguide with a coaxial RF adapter on both sides. The network analyzer is set to measure the magnitude and phase of the reflection parameter S. The plasma column is ignited to measure the difference between RF on-state and off-state.
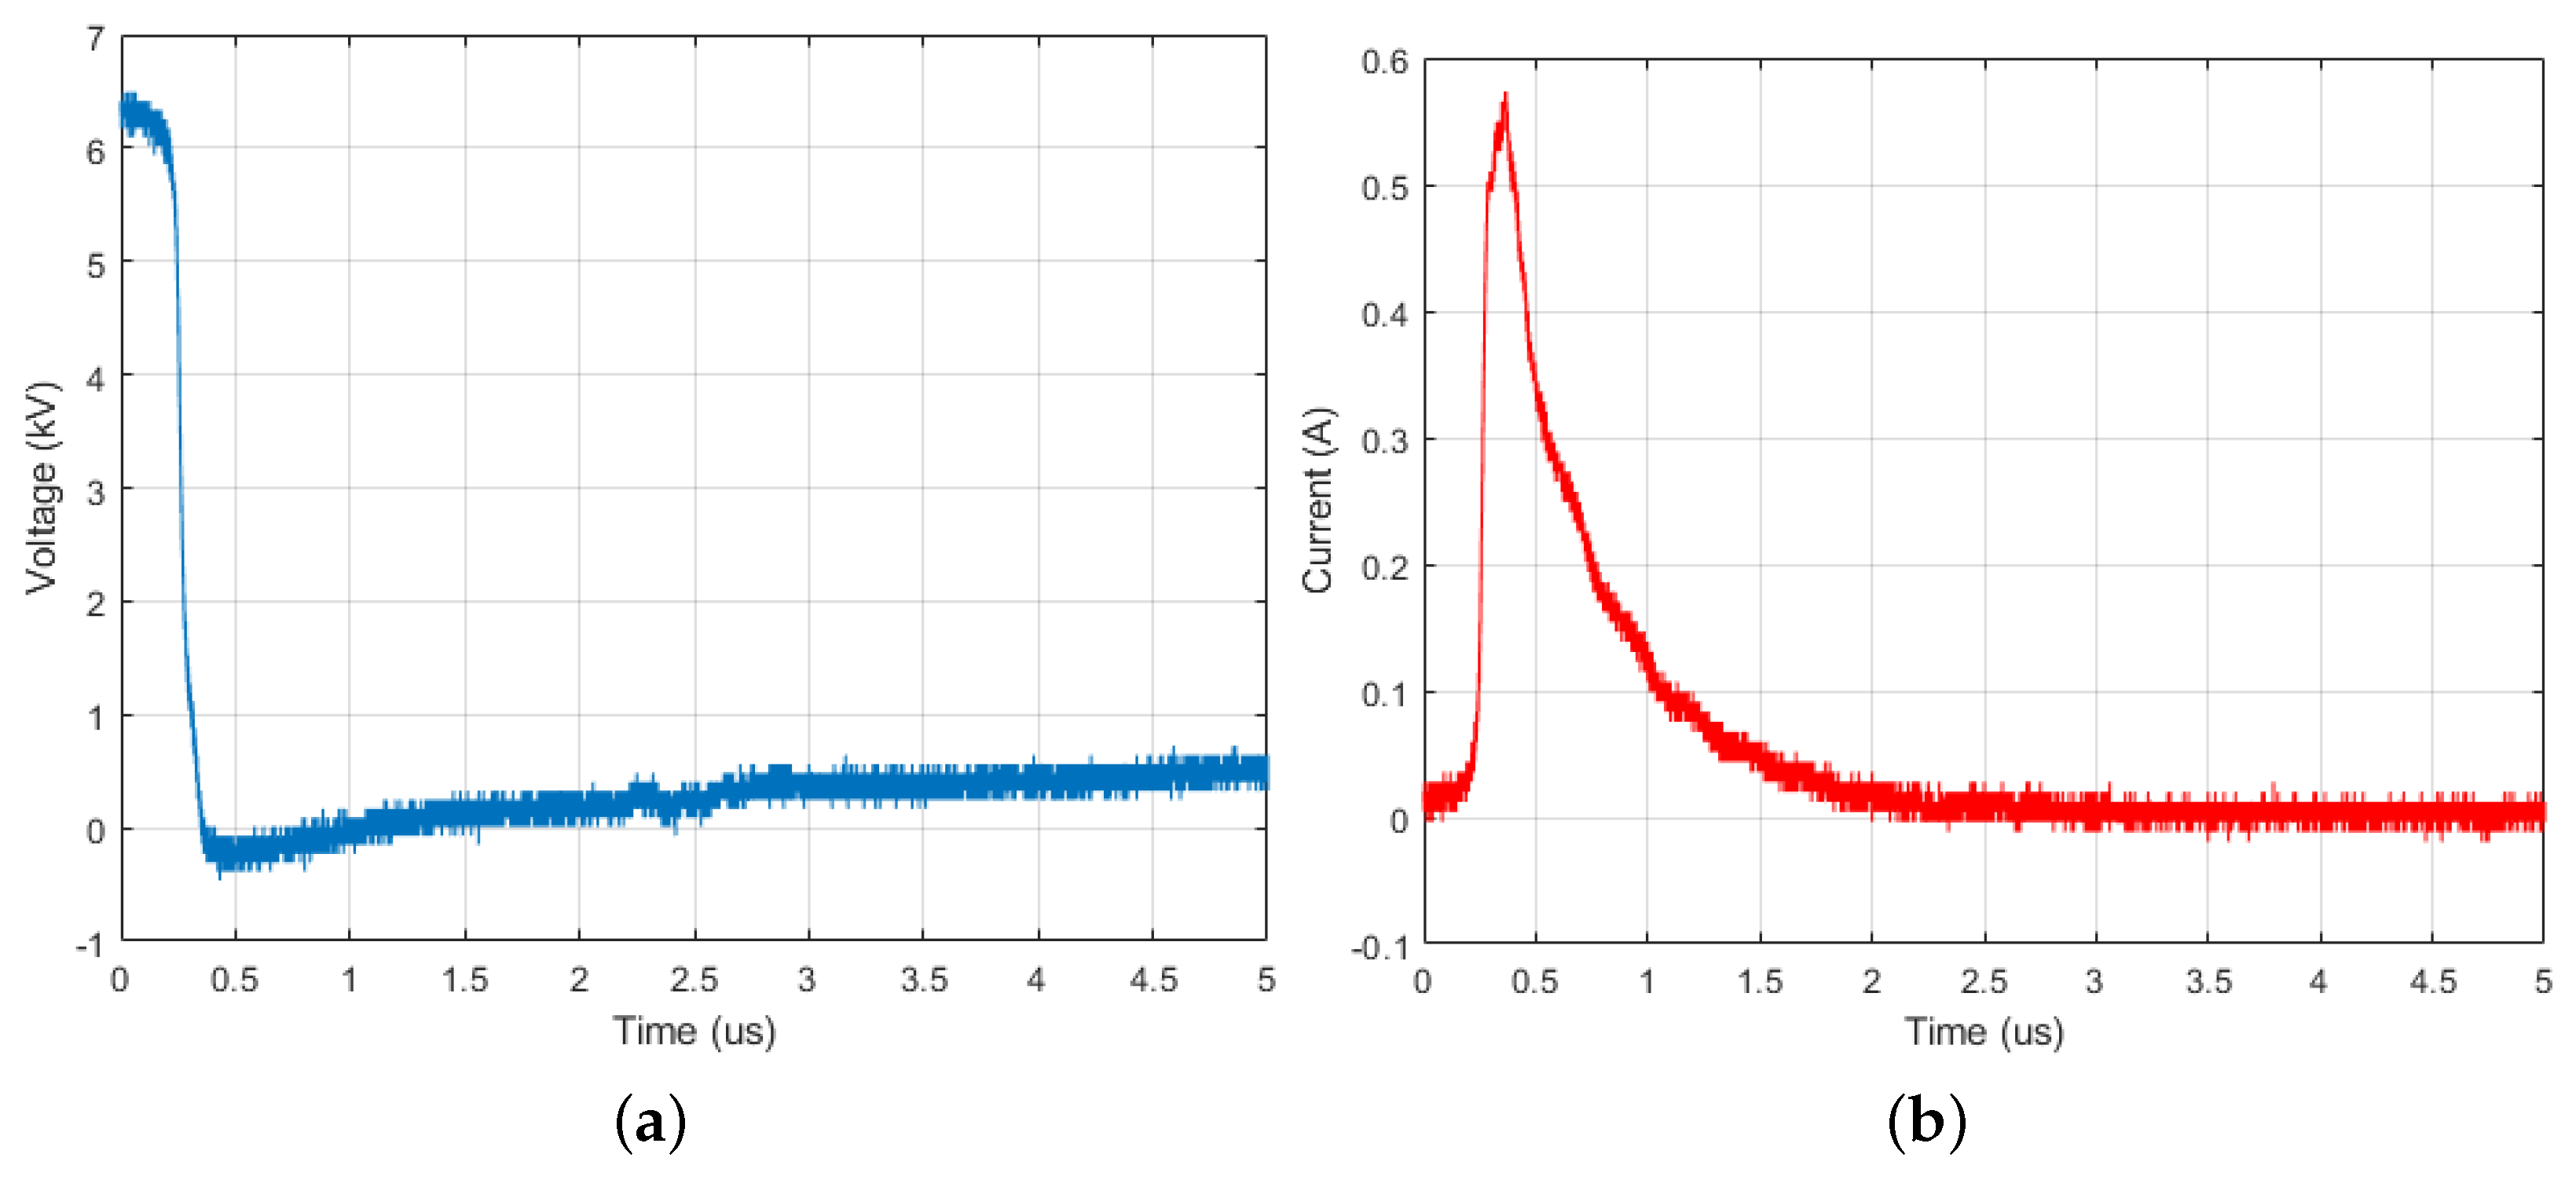
The voltage response of the tube is shown in Figure 10a. With an input voltage of 6.5 kV, the switch enters self-break mode, and the value reaches 500 V at steady state. Similarly, the current response exhibits the opposite trend, reaching a steady state value of peak supply current of 30 mA (see Figure 10b).
The reflection coefficient (S) response of the RF–plasma switch is shown in Figure 11a, which shows that the magnitude of S is increased when the switch is ignited. The value goes from −40 dB in the switch off state to −13 dB when the switch is ignited, corresponding to a difference of 27 dB. This shows that the plasma column can reflect the RF signal, which proves that the plasma frequency is greater than RF signal. Similarly, the corresponding phase at the same frequency is observed and shown in Figure 11b. The on- and off-state states of the tube cause a 180 phase shift in the S.
5. Conclusions
This paper discussed the significance of RF–plasma interaction and its theoretical understanding. The interaction behavior is observed in Magic3D and a simulation study of argon plasma generation with the required characteristics is performed in COMSOL. It is calculated that the plasma density, observed through simulations, results in a plasma frequency of 7.18 GHz. This plasma frequency reflects a lower-frequency band, which, in our case, is the S-band (3 GHz). Experimental testing is conducted with low-pressure, argon-filled glass tubes of the given specifications. The plasma is sustained at 500 V, with the tube placed in a cavity between two coaxial waveguide adapters. A network analyzer is used to determine the effects of the plasma on the input RF. Results show a difference of 180 in phase shift and a 27 dB difference in reflected magnitude.
Author Contributions
Conceptualization, A.M.K.; methodology, A.M.K. and M.M.A.; software, A.M.K.; validation, M.M.A. and U.R.; formal analysis, A.M.K., M.M.A. and U.R.; investigation, A.M.K. and M.M.A.; resources, A.M.K.; writing—original draft preparation, A.M.K.; writing—review and editing, M.M.A. and U.R.; visualization, A.M.K.; supervision, M.M.A.; funding acquisition, U.R. All authors have read and agreed to the published version of the manuscript.
Funding
This project received no external funding.
Data Availability Statement
The data presented in this study are available on request from the corresponding authors.
Conflicts of Interest
The authors declare no conflict of interest.
References
- Mathew, P.; George, J.; Mathews T, S.; Kurian, P. Experimental verification of modified Paschen’s law in DC glow discharge argon plasma. AIP Adv. 2019, 9, 025215. [Google Scholar] [CrossRef] [Green Version]
- Karsli, O.; Dogan, M.; Ahiska, F.; Surel, O.O. Implementation of high power microwave pulse compressor. IEEE Trans. Plasma Sci. 2019, 47, 2823–2831. [Google Scholar] [CrossRef]
- Somayajula, S.K.; Sriram, A.; Shelar, V.M. Study of Argon and Xenon gas properties on DC-glow discharge plasma. In Journal of Physics: Conference Series; IOP Publishing: Coimbatore, Tamil Nadu, India, 2020; Volume 1706, p. 012030. [Google Scholar]
- Zhang, W.; Wu, L.; Huang, K.; Tao, J. Propagating modes of the travelling wave in a microwave plasma torch with metallic enclosure. Phys. Plasmas 2019, 26, 042101. [Google Scholar] [CrossRef]
- Chiad, B.; Al-Zubaydi, T.; Khalaf, M.; Khudiar, A. Construction and characterization of a low pressure plasma reactor using DC glow discharge. J. Optoelectron. Biomed. Mater. 2009, 1, 255–262. [Google Scholar]
- Benstâali, W.; Belasri, A. Discharge Efficiency Improvement in PDP Cell via a 1-D PIC/MCC method. IEEE Trans. Plasma Sci. 2011, 39, 1460–1465. [Google Scholar] [CrossRef]
- Piel, A. Plasma Physics: An Introduction to Laboratory, Space, and Fusion Plasmas; Springer: Berlin/Heidelberg, Germany, 2017. [Google Scholar]
- Pozar, D.M. Microwave Engineering. Fourth Editions, University of Massachusetts at Amherst; John Wiley & Sons, Inc.: Hoboken, NJ, USA, 2012; pp. 26–30. [Google Scholar]
- Lisovskiy, V.; Koval, V.; Artushenko, E.; Yegorenkov, V. Validating the Goldstein–Wehner law for the stratified positive column of DC discharge in an undergraduate laboratory. Eur. J. Phys. 2012, 33, 1537. [Google Scholar] [CrossRef]
- Şahin, Ö.; Tapan, I.; Özmutlu, E.N.; Veenhof, R. Penning transfer in argon-based gas mixtures. J. Instrum. 2010, 5, P05002. [Google Scholar] [CrossRef]
Figure 1.
Interaction between standing RF waves and beam switch.

Figure 2.
Standing wave reflection after RF–beaminteraction.

Figure 3.
Schematic of DC glow discharge showing several distinct regions that appear between cathode and anode.
Figure 3.
Schematic of DC glow discharge showing several distinct regions that appear between cathode and anode.

Figure 4.
Schematic of plasma column.

Figure 5.
Visualization of constant voltage across the plasma column.

Figure 6.
Visualization of plasma column at 500 V.

Figure 7.
Electron density plots for a voltage sweep of 400 V to 700 V.

Figure 8.
(a) Schematic of experimental setup; (b) experimental setup with vacuum pump, argon tank, pressure gauge, and high voltage DC power supply connected to a plasma tube.
Figure 8.
(a) Schematic of experimental setup; (b) experimental setup with vacuum pump, argon tank, pressure gauge, and high voltage DC power supply connected to a plasma tube.

Figure 9.
Experimental demonstration of DC glow discharge.

Figure 10.
Experimentally obtained (a) voltage and (b) current response of plasma tube.

Figure 11.
(a) Magnitude and (b) phase response of S.


Table 1.
Simulation parameters for plasma column.
| Parameter | Value |
|---|---|
| Axial lengh of tube | 100 mm |
| Plasma column length | 76 mm |
| Pressure | 3.8 Torr |
| Reduced electron mobility | 1.25 × 10 |
| Work function | 5 eV |
| Temperature | 20 C |
Table 2.
Modeled collisions and reactions.
| Reaction | Formula | Type | (eV) |
|---|---|---|---|
| 1 | Elastic | 0 | |
| 2 | Excitation | 11.5 | |
| 3 | Super-elastic | −11.5 | |
| 4 | Ionization | 15.8 | |
| 5 | Ionization | 4.24 | |
| 6 | Penning Ionization | − | |
| 7 | Metasbale Quenching | − |
Disclaimer/Publisher’s Note: The statements, opinions and data contained in all publications are solely those of the individual author(s) and contributor(s) and not of MDPI and/or the editor(s). MDPI and/or the editor(s) disclaim responsibility for any injury to people or property resulting from any ideas, methods, instructions or products referred to in the content. |
© 2023 by the authors. Licensee MDPI, Basel, Switzerland. This article is an open access article distributed under the terms and conditions of the Creative Commons Attribution (CC BY) license (https://creativecommons.org/licenses/by/4.0/).
Share and Cite
MDPI and ACS Style
Khan, A.M.; Ahmed, M.M.; Rafique, U. Experimental Study of RF–Plasma Interaction Using a Low-Pressure DC Glow Discharge Tube for MPC. Electronics 2023, 12, 551. https://doi.org/10.3390/electronics12030551
AMA Style
Khan AM, Ahmed MM, Rafique U. Experimental Study of RF–Plasma Interaction Using a Low-Pressure DC Glow Discharge Tube for MPC. Electronics. 2023; 12(3):551. https://doi.org/10.3390/electronics12030551
Chicago/Turabian StyleKhan, Asif Mehmood, Muhammad Mansoor Ahmed, and Umair Rafique. 2023. "Experimental Study of RF–Plasma Interaction Using a Low-Pressure DC Glow Discharge Tube for MPC" Electronics 12, no. 3: 551. https://doi.org/10.3390/electronics12030551
Note that from the first issue of 2016, this journal uses article numbers instead of page numbers. See further details here.